Investigating A Signal
Continuing from where we left off in part 1, we will now consider the idea of a spike level in the VIX and how we might use a spike level to generate a signal. These elevated levels usually occur during market sell-off events or longer term drawdowns in the S&P 500. Sometimes the VIX reverts to recent levels after a spike, but other times levels remain elevated for weeks or even months.
Determining A Spike Level
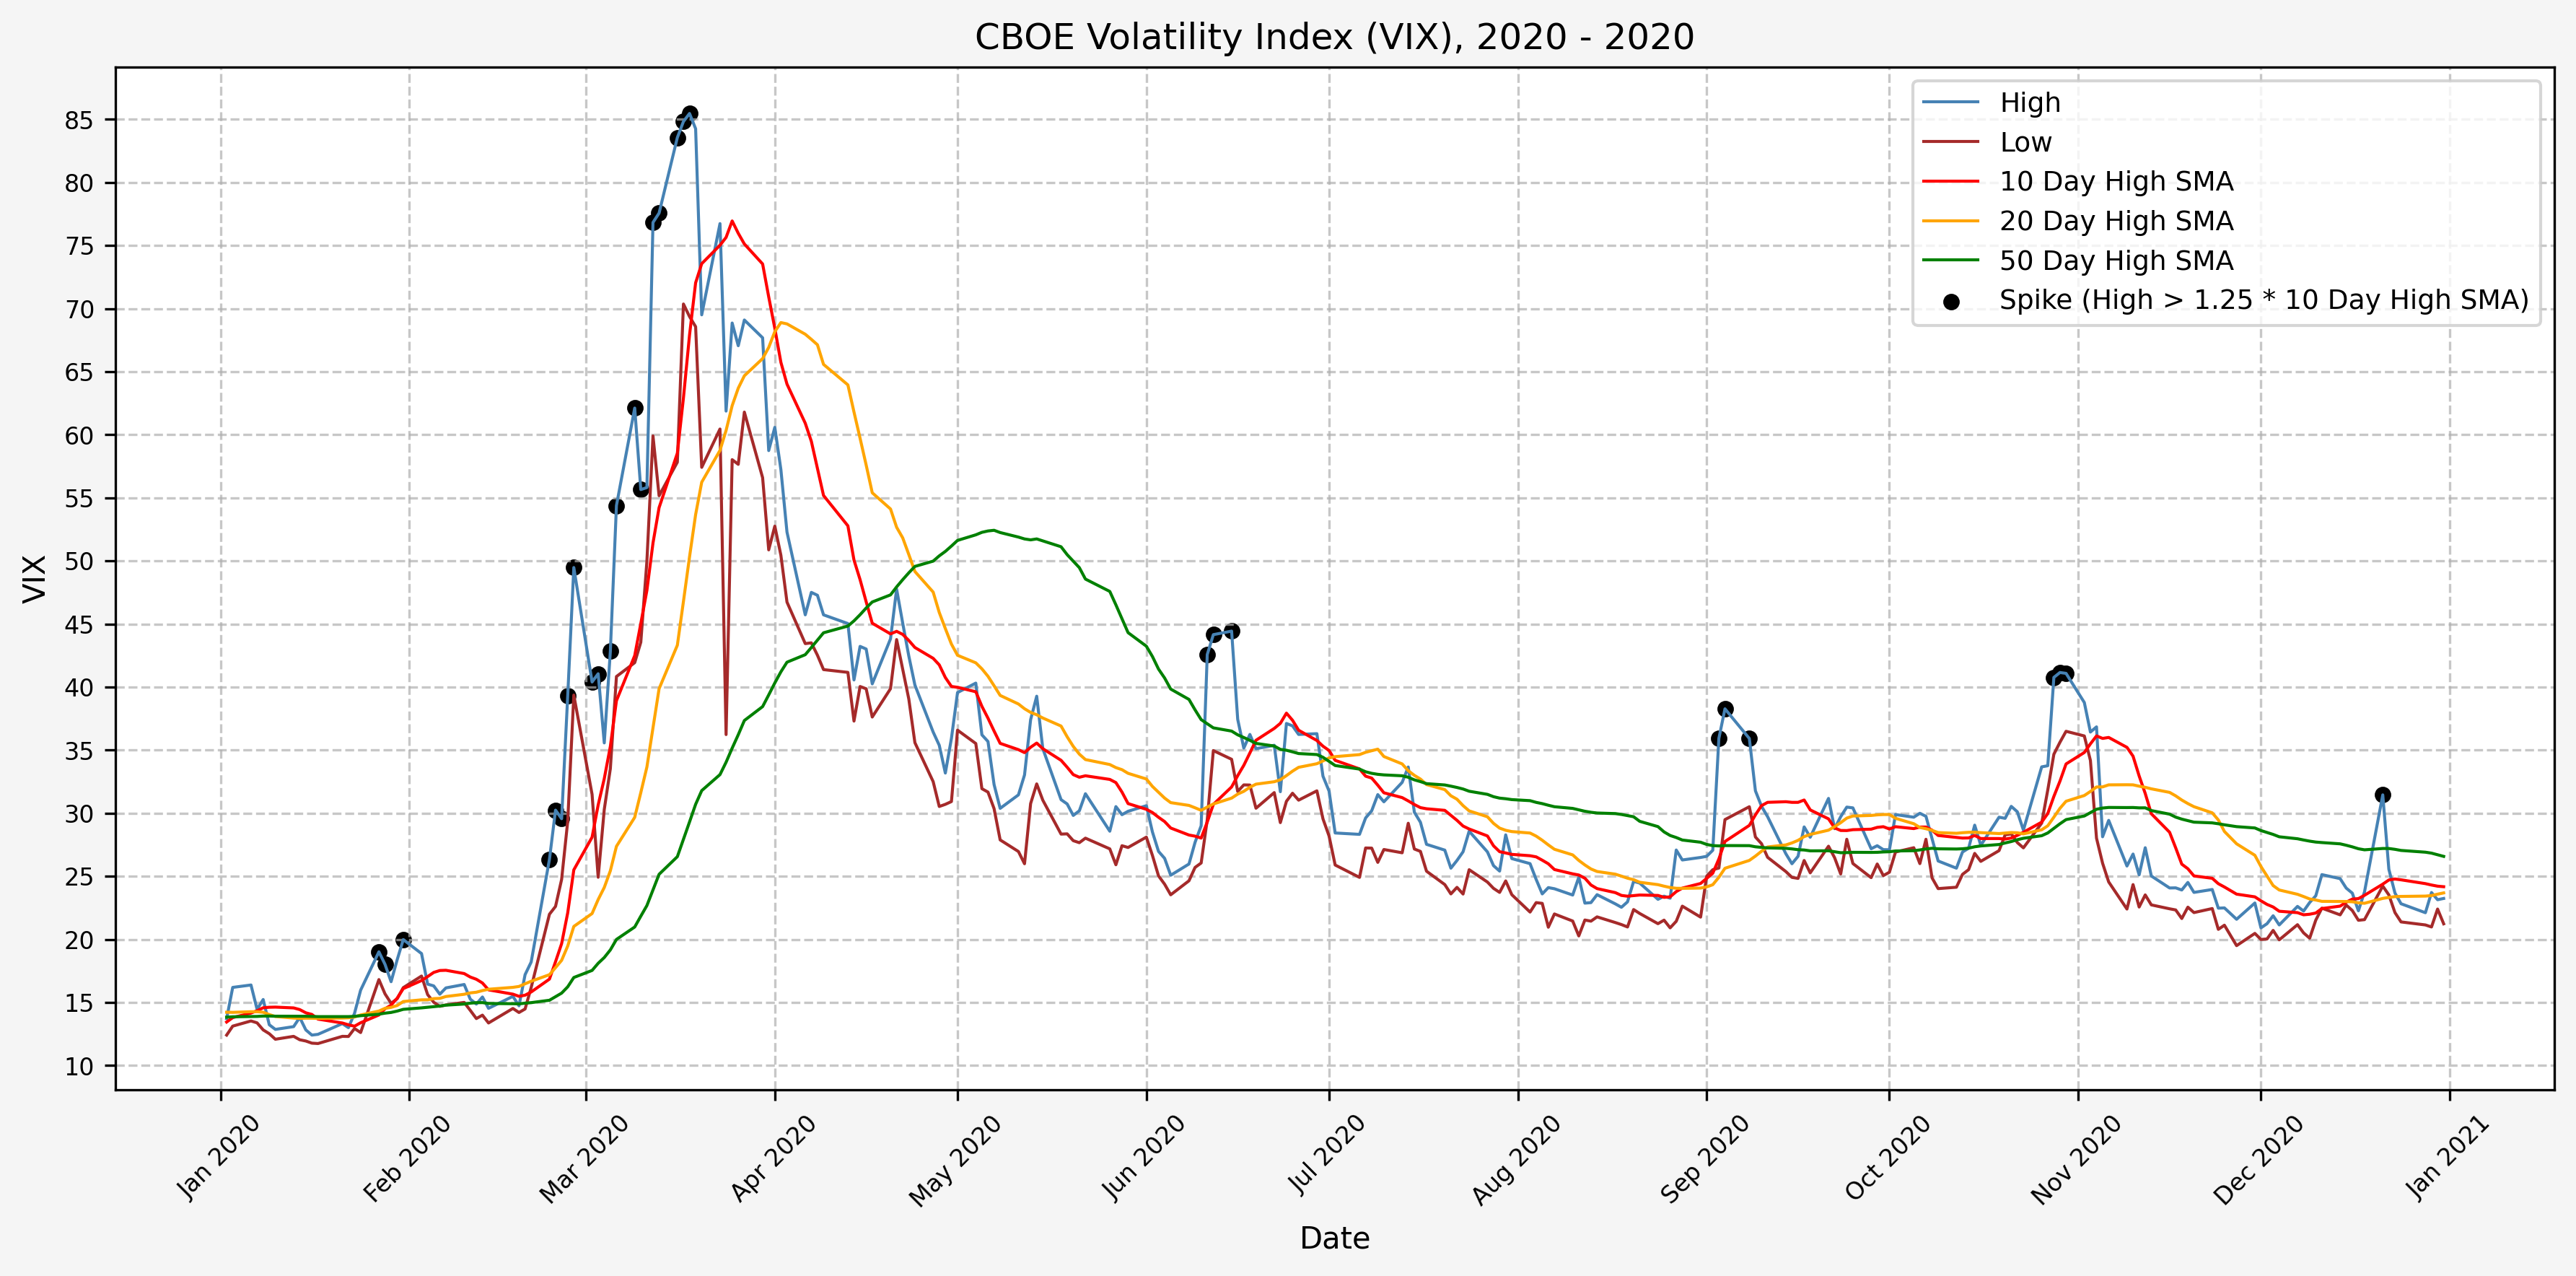
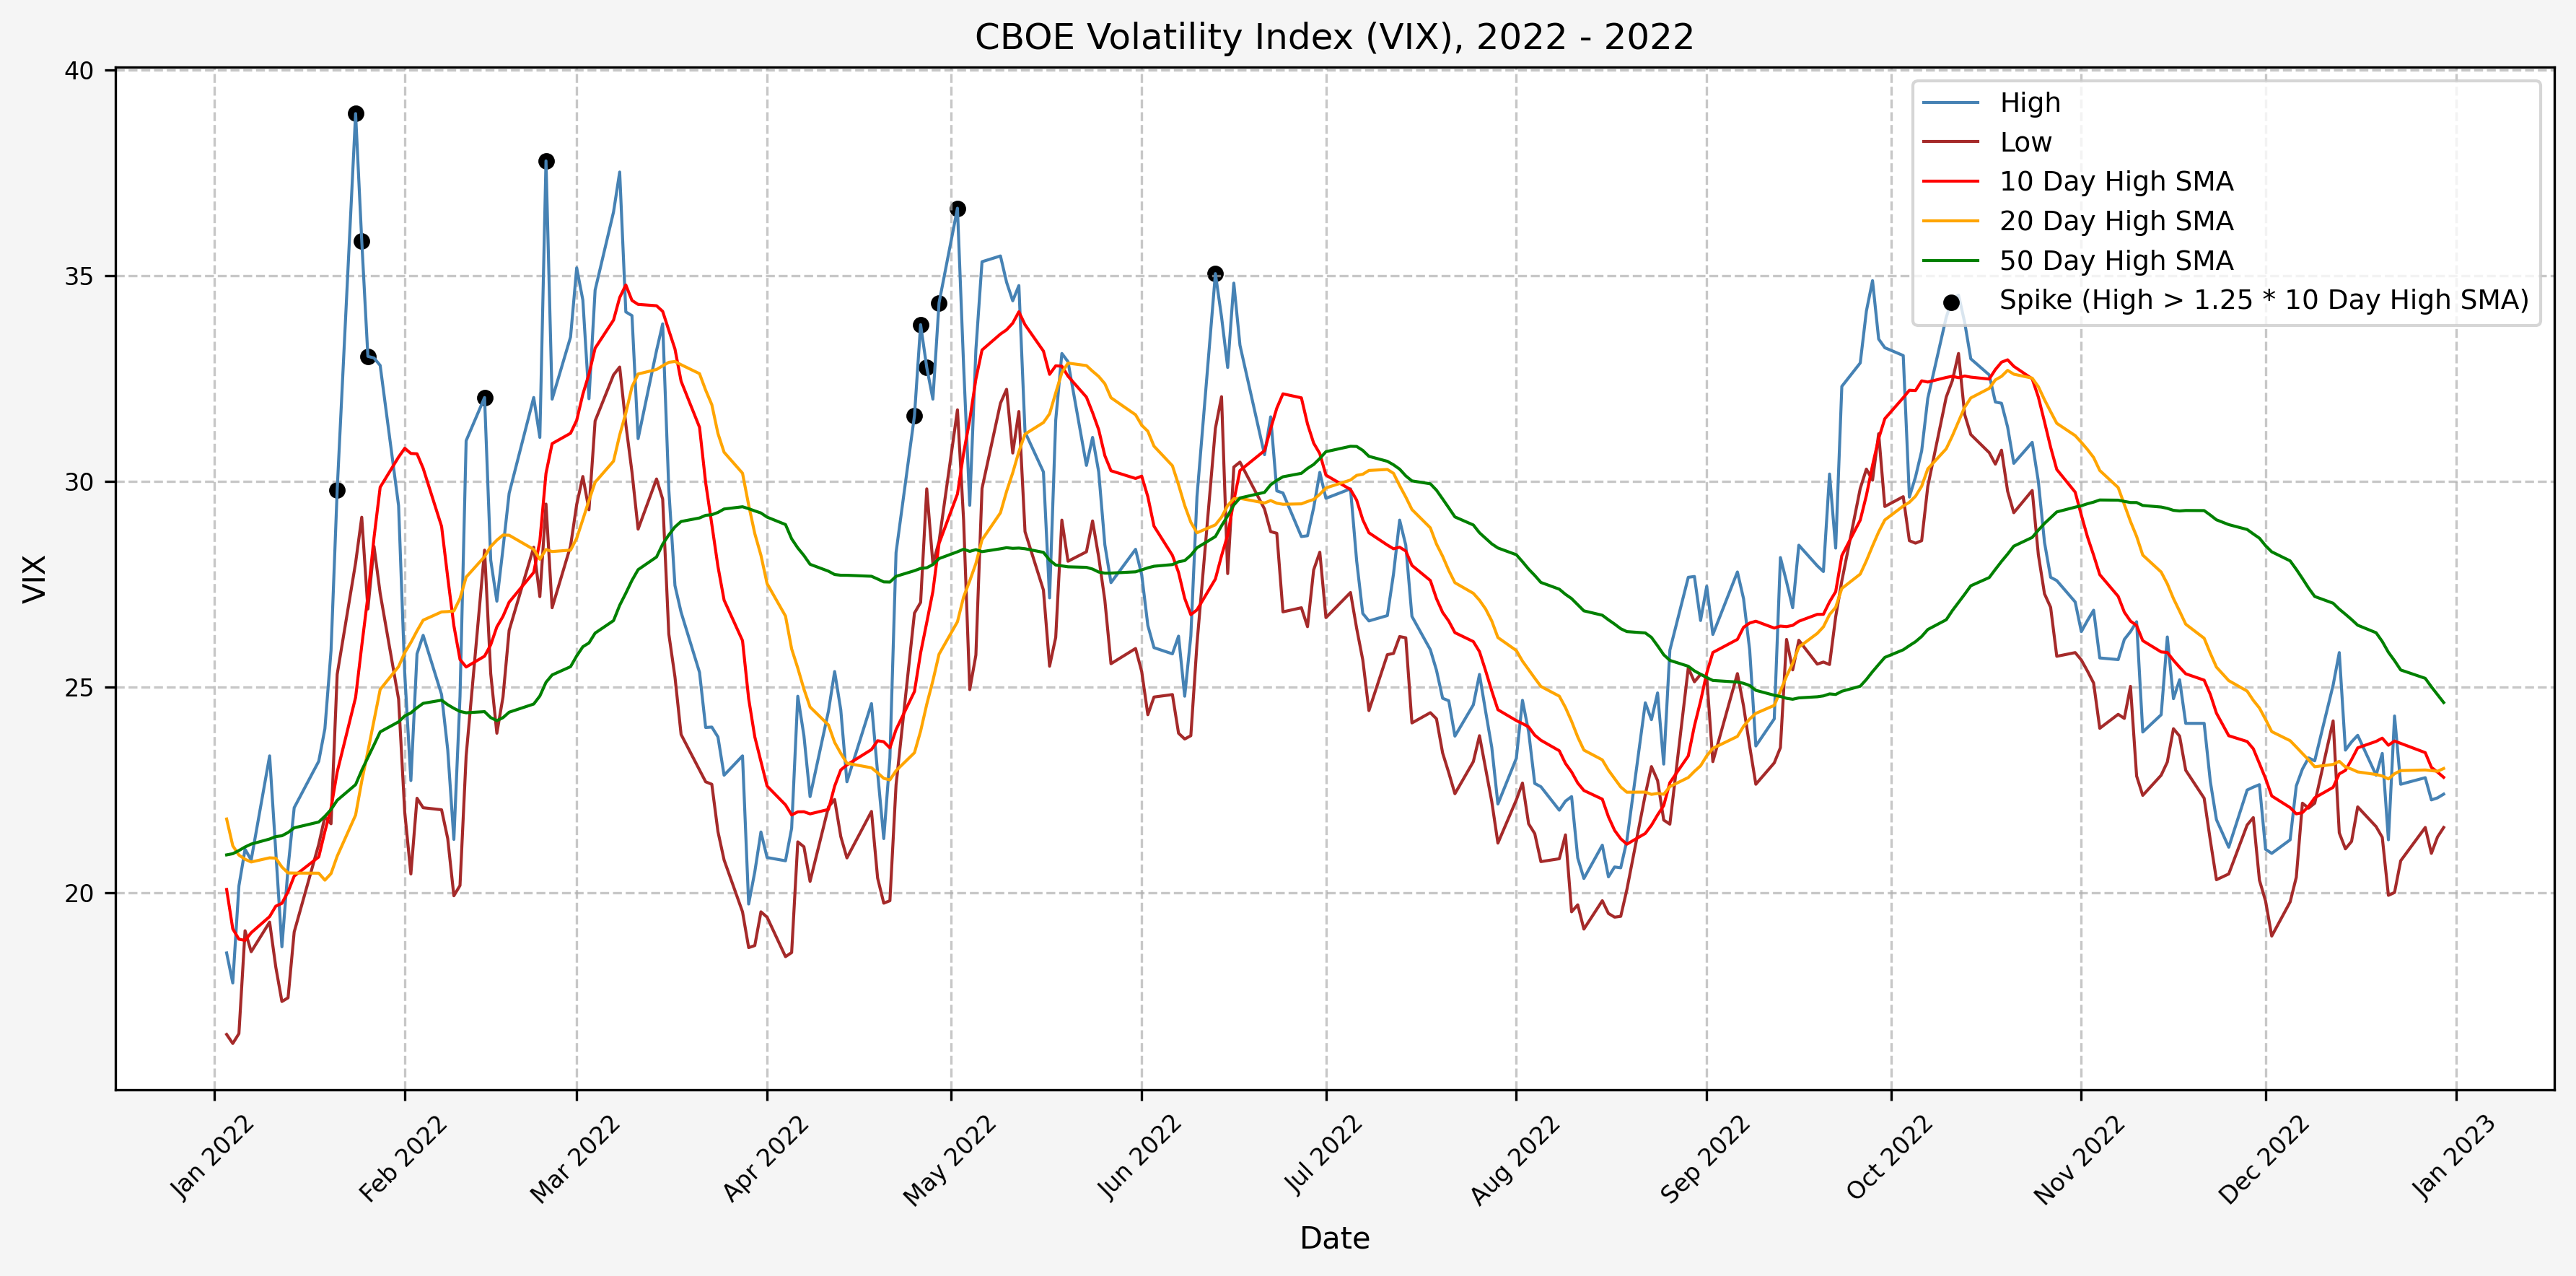
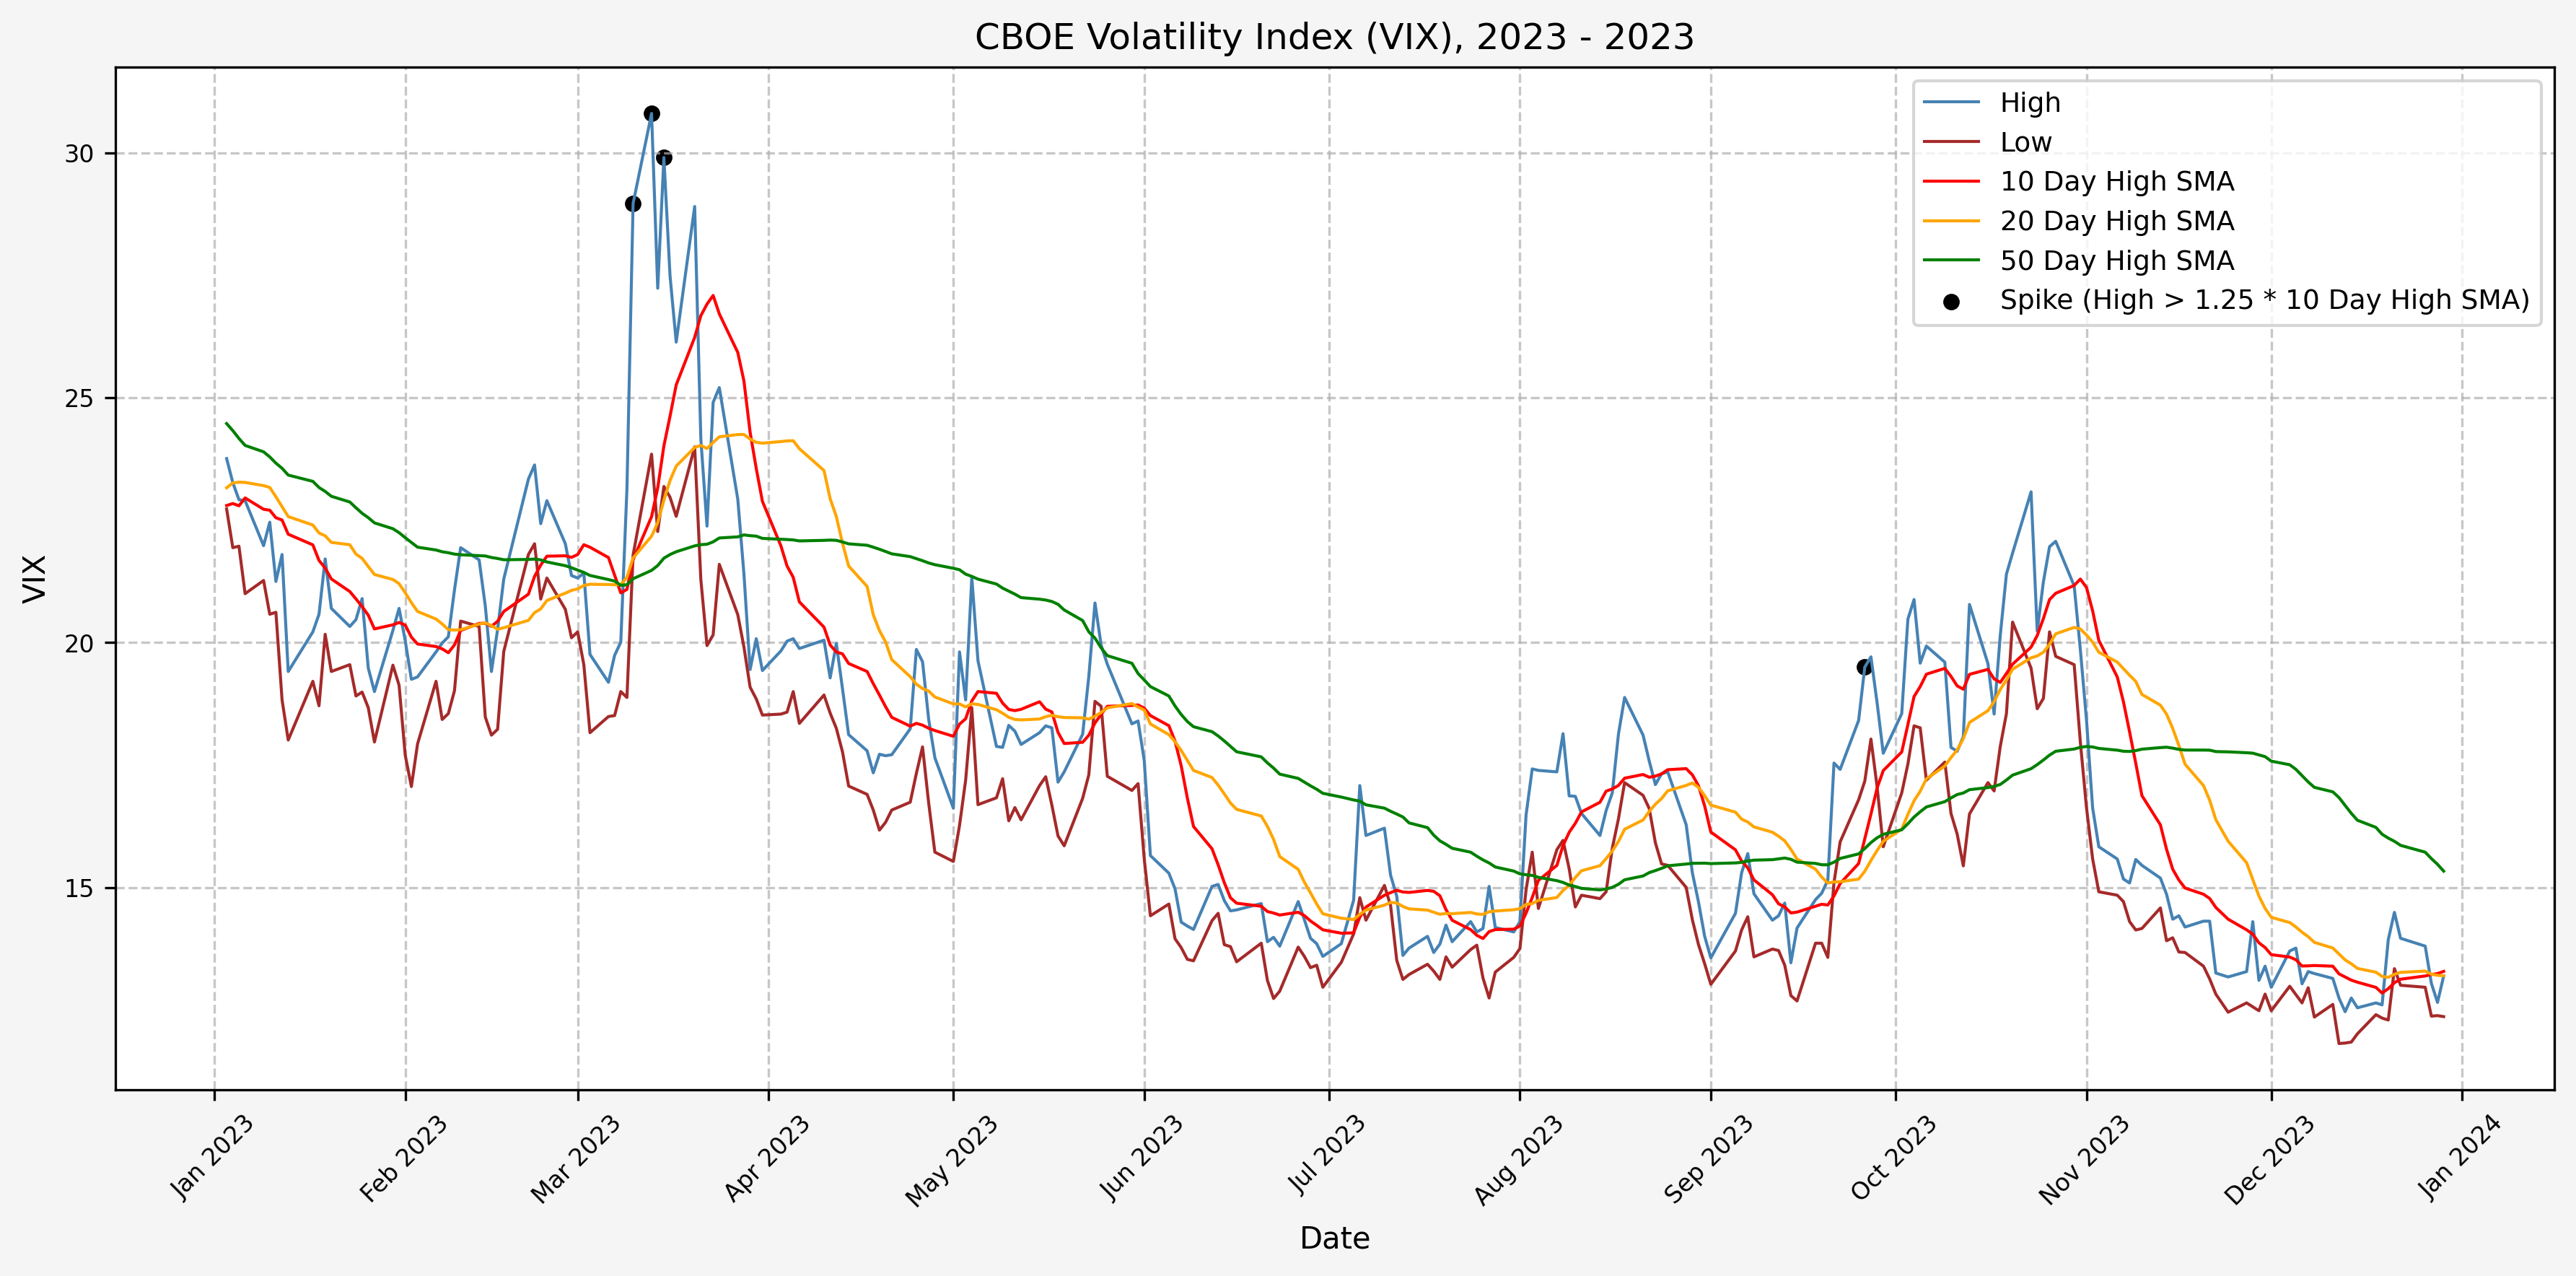
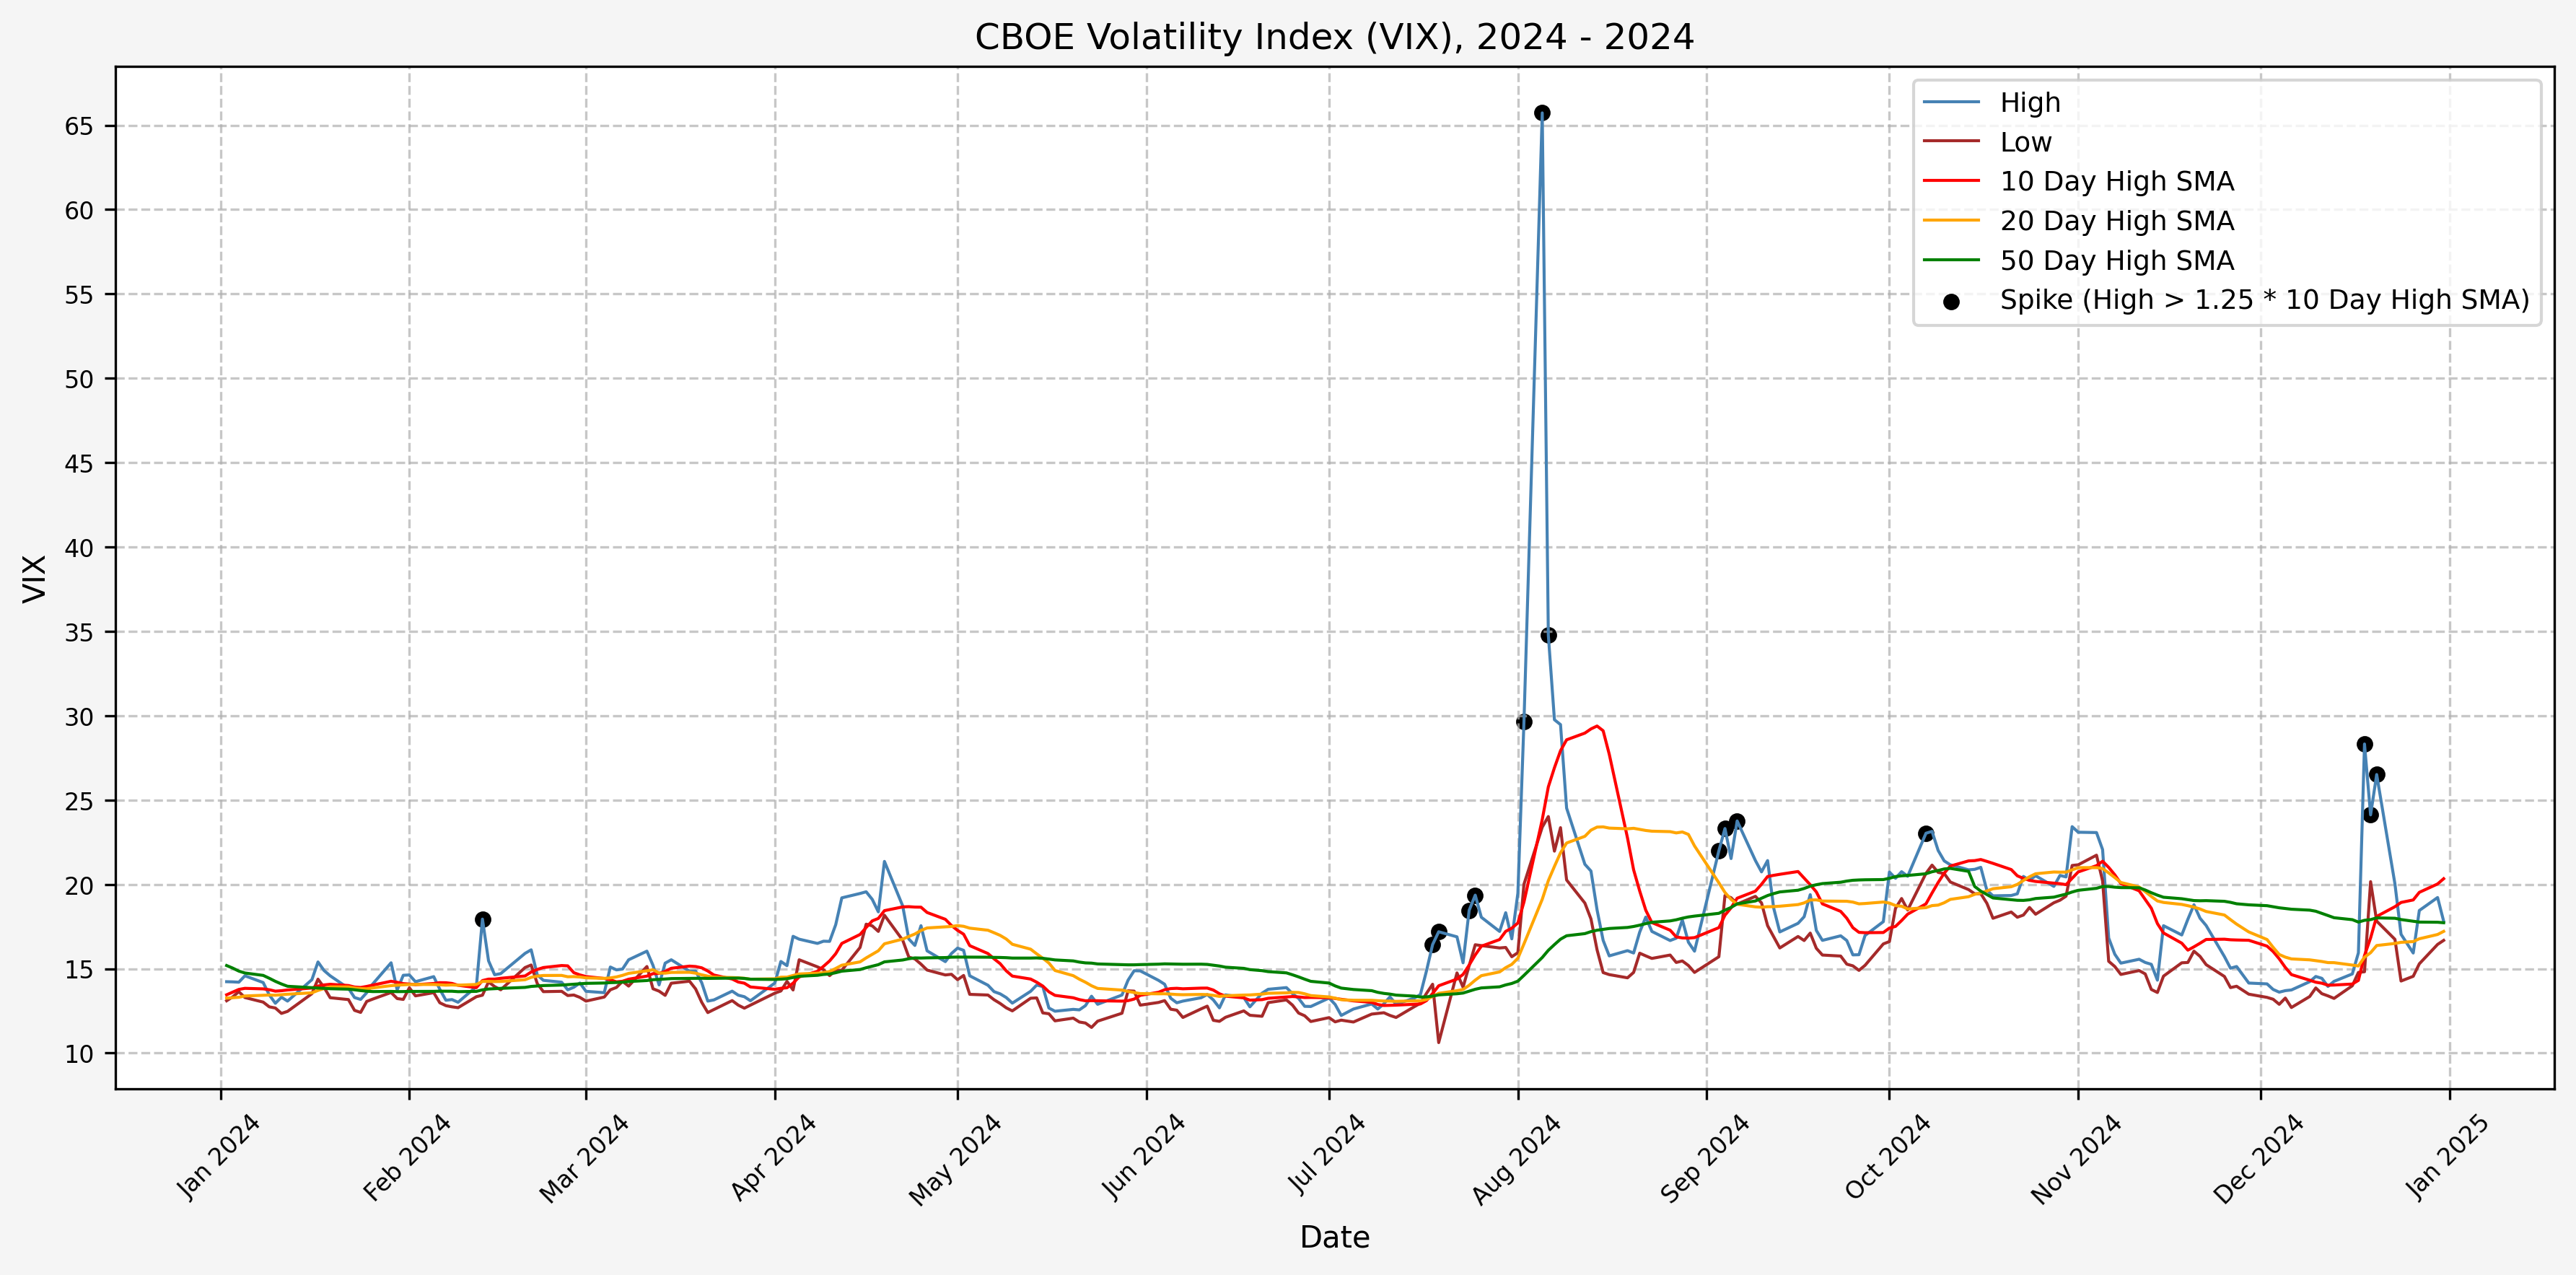
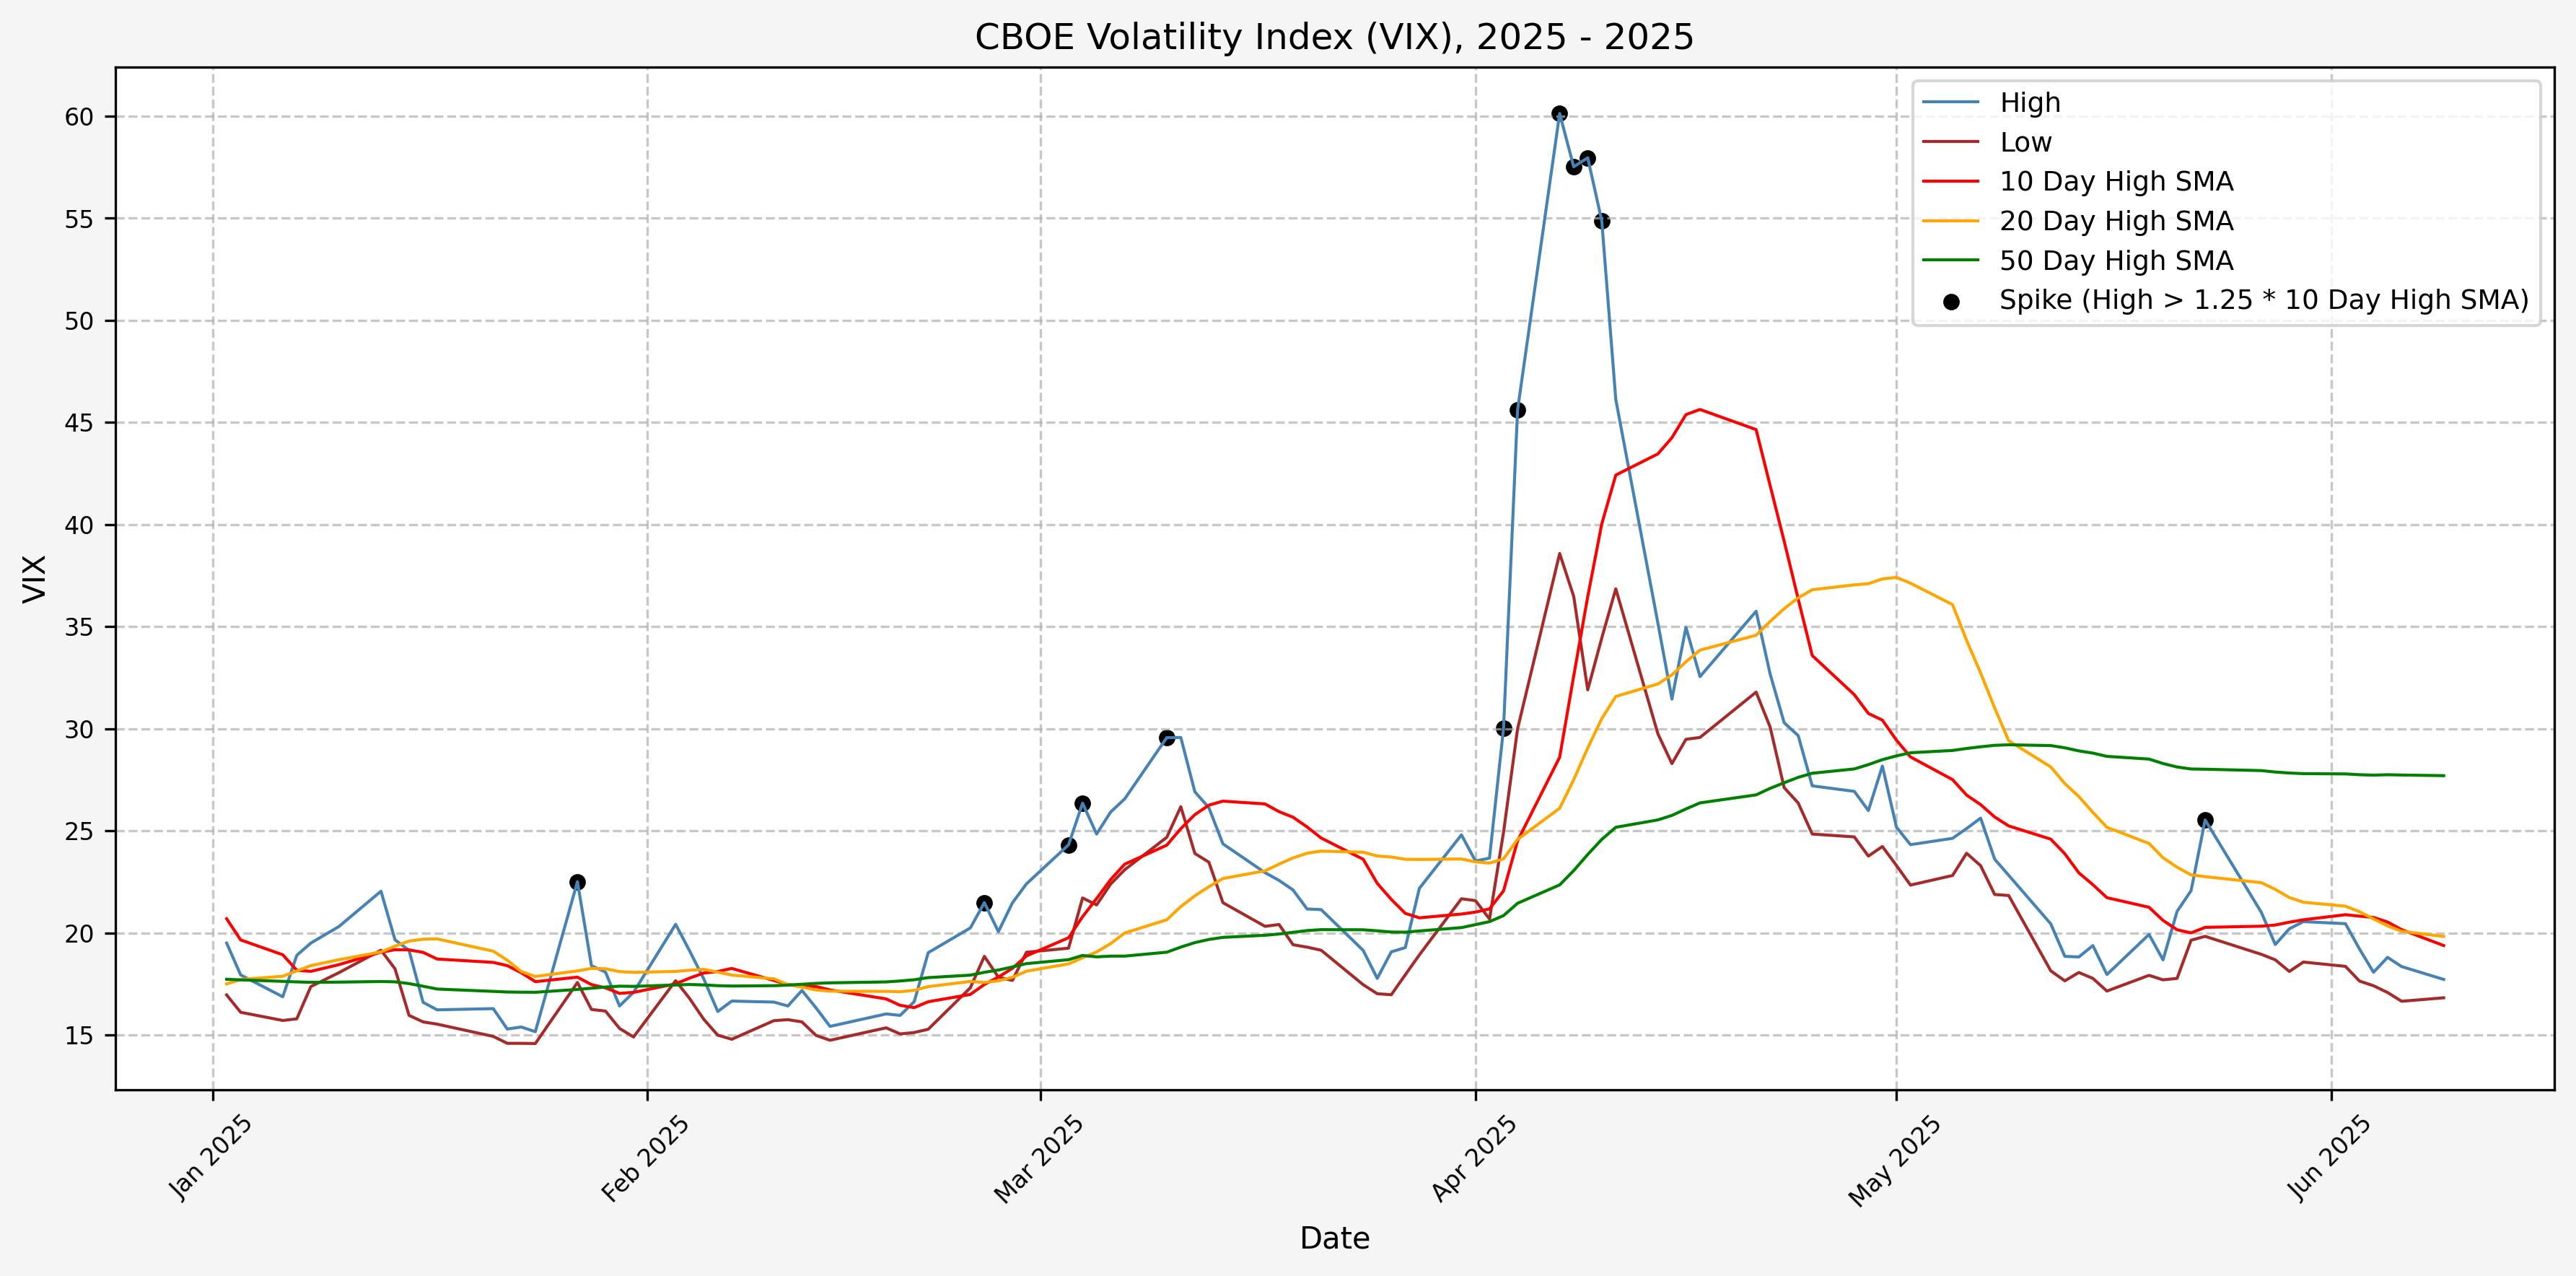
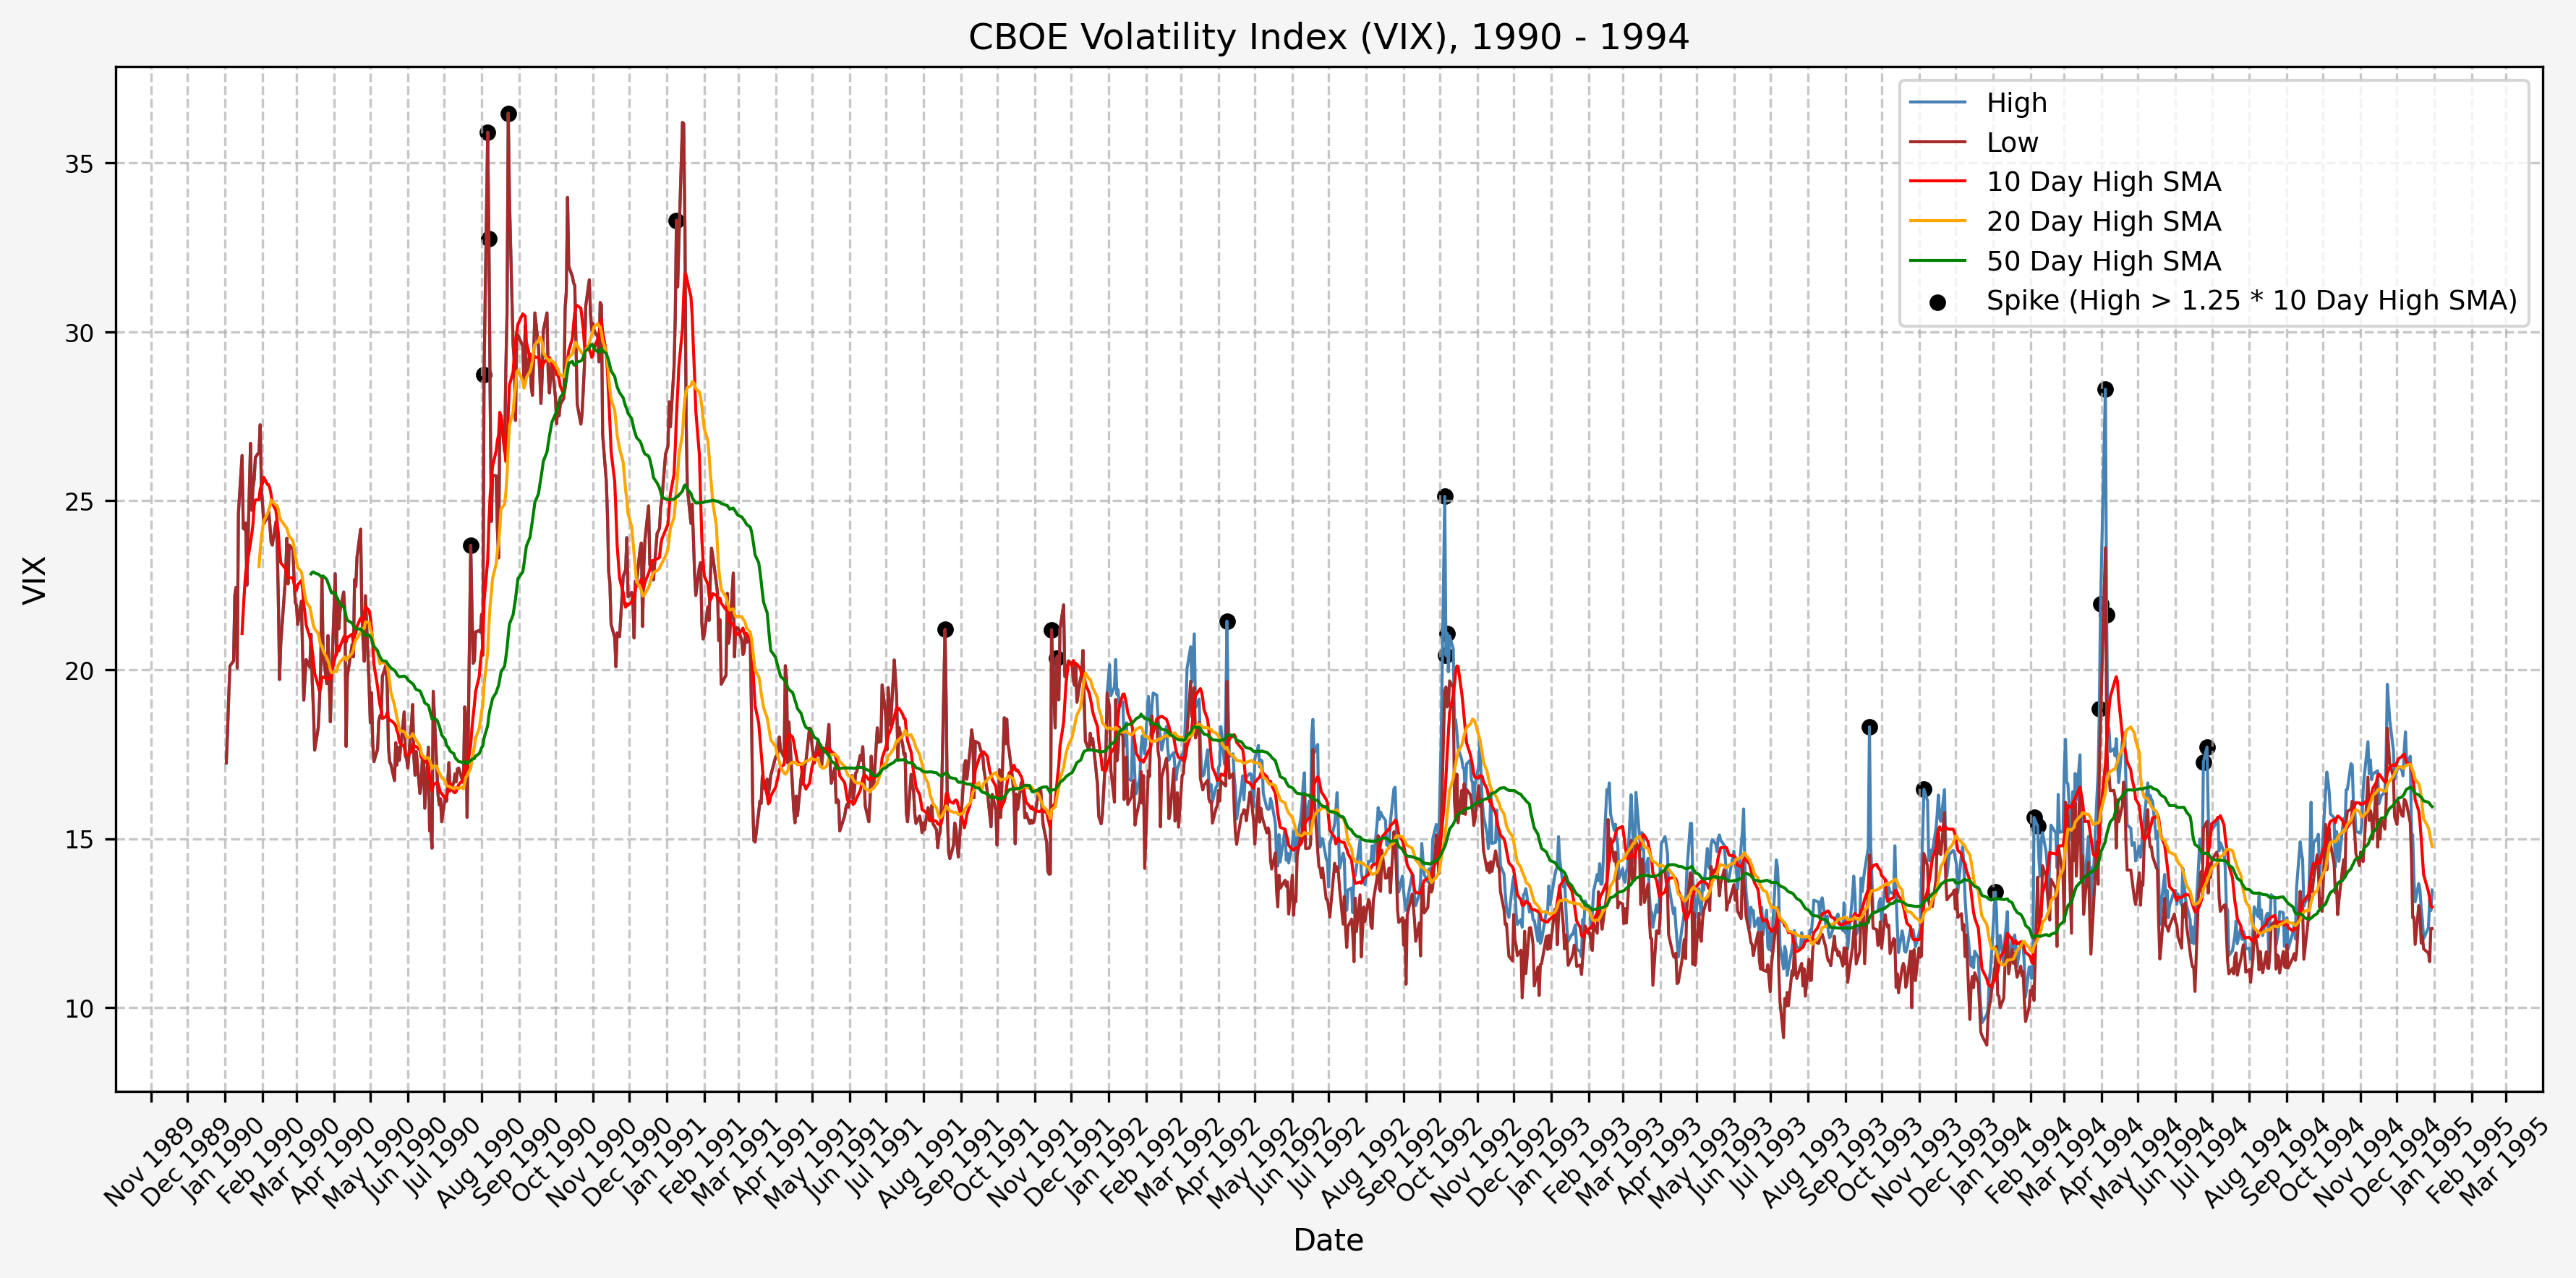
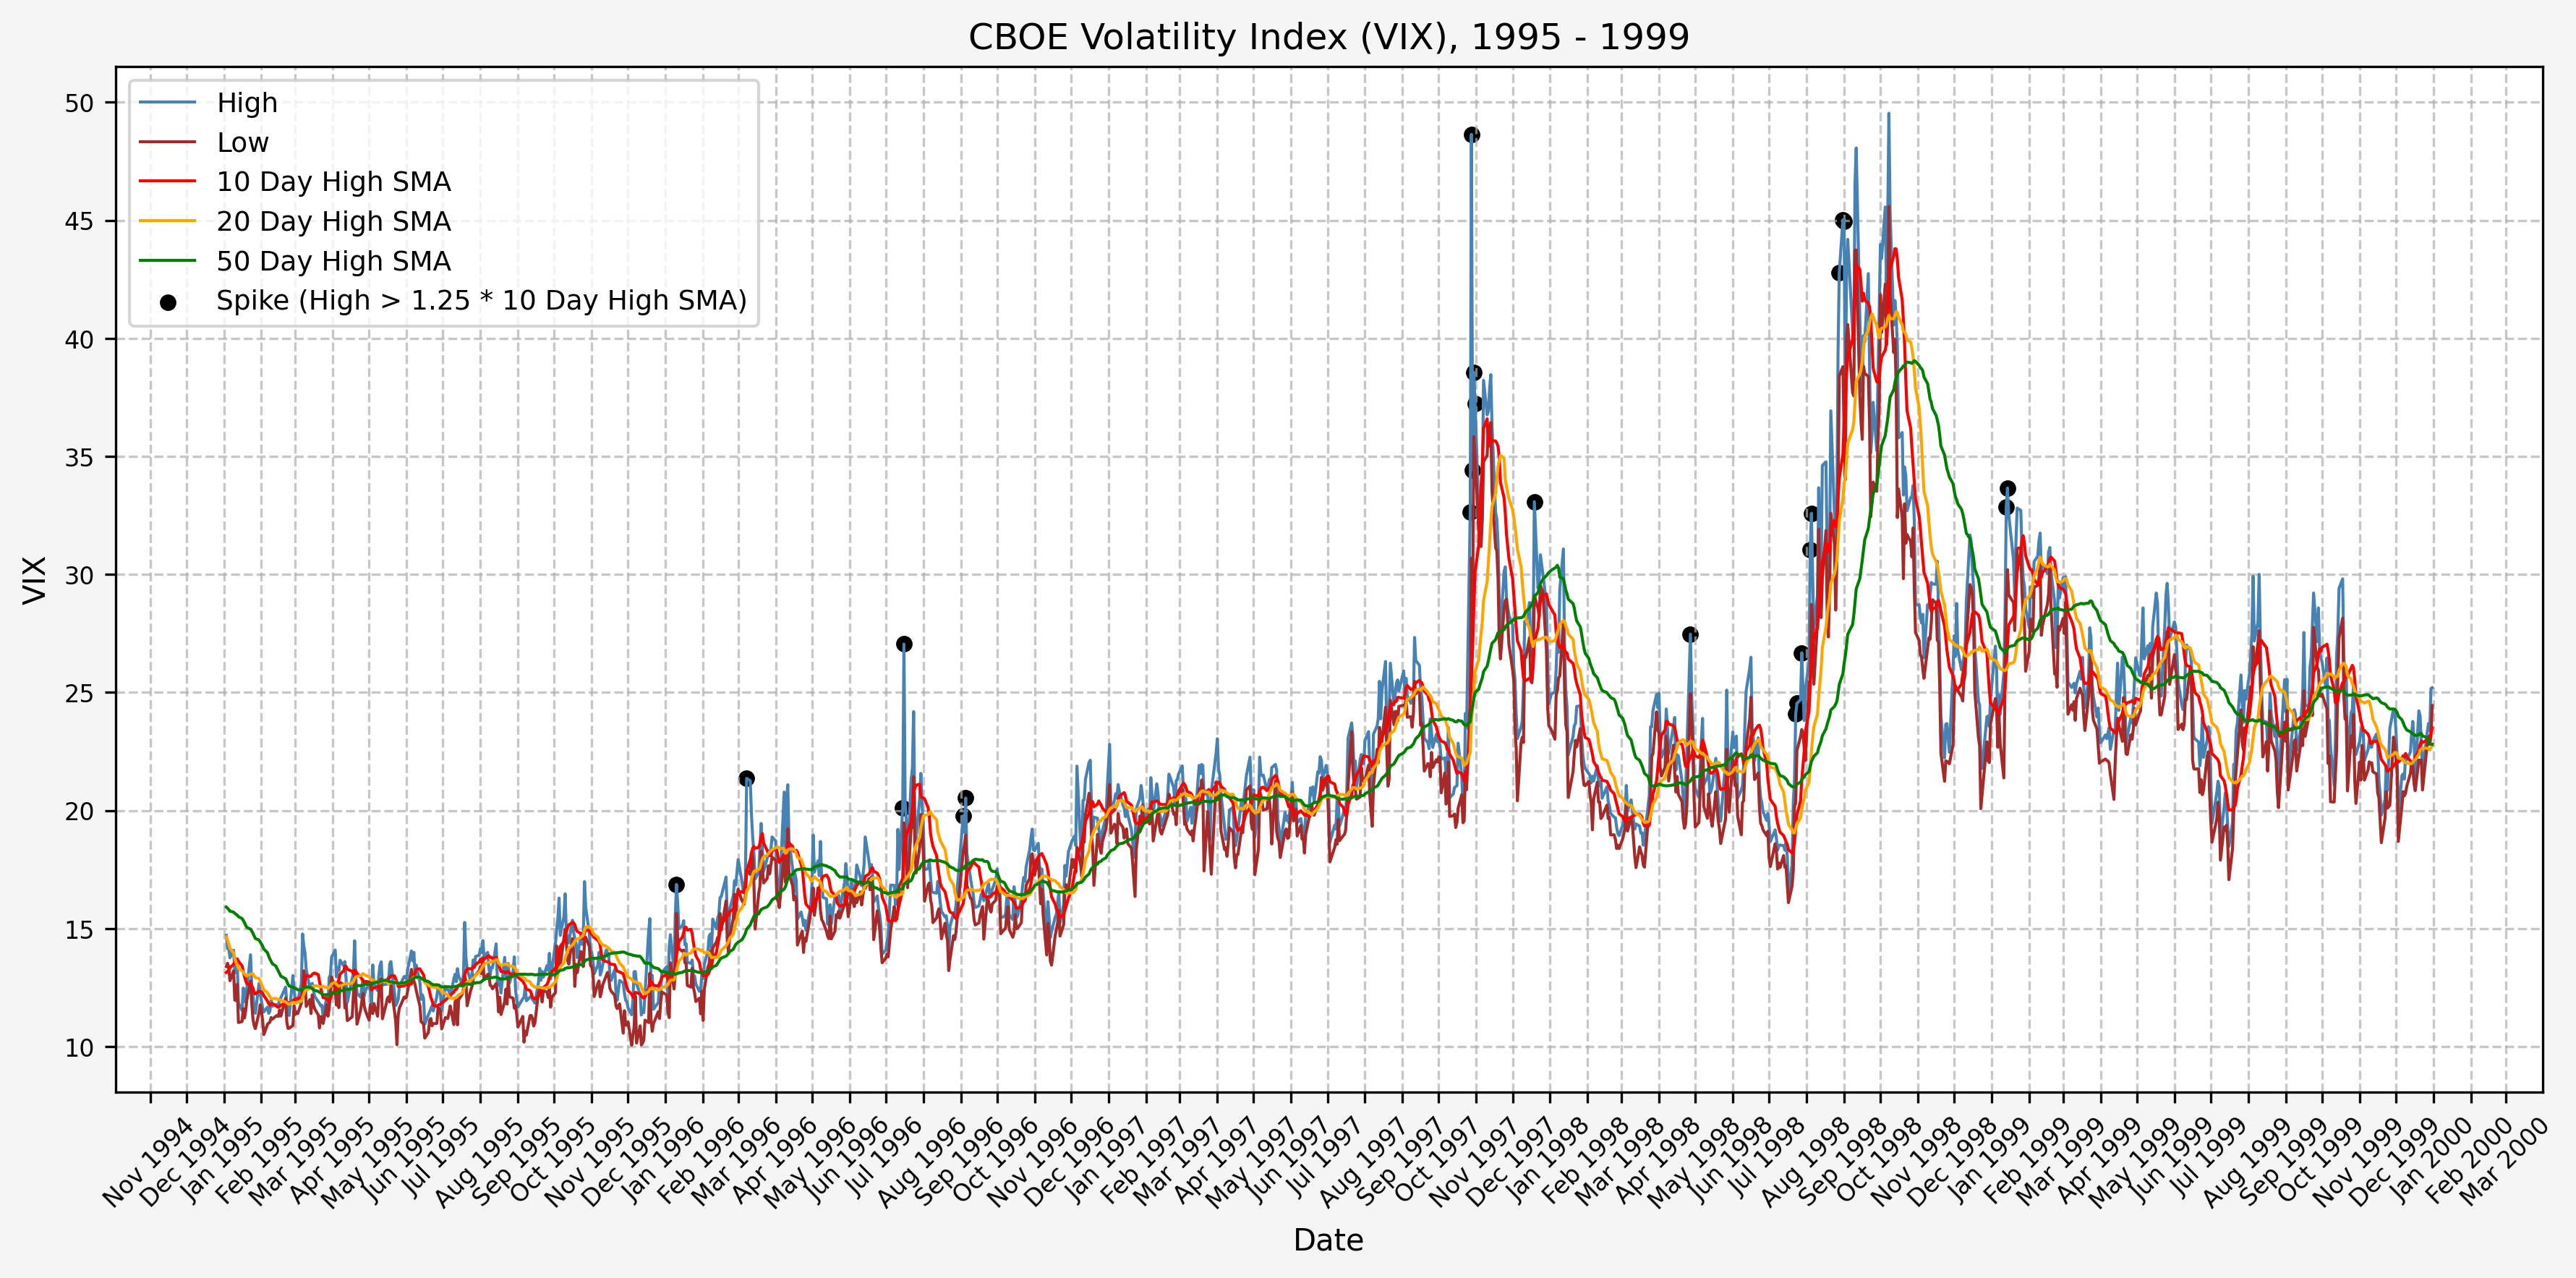
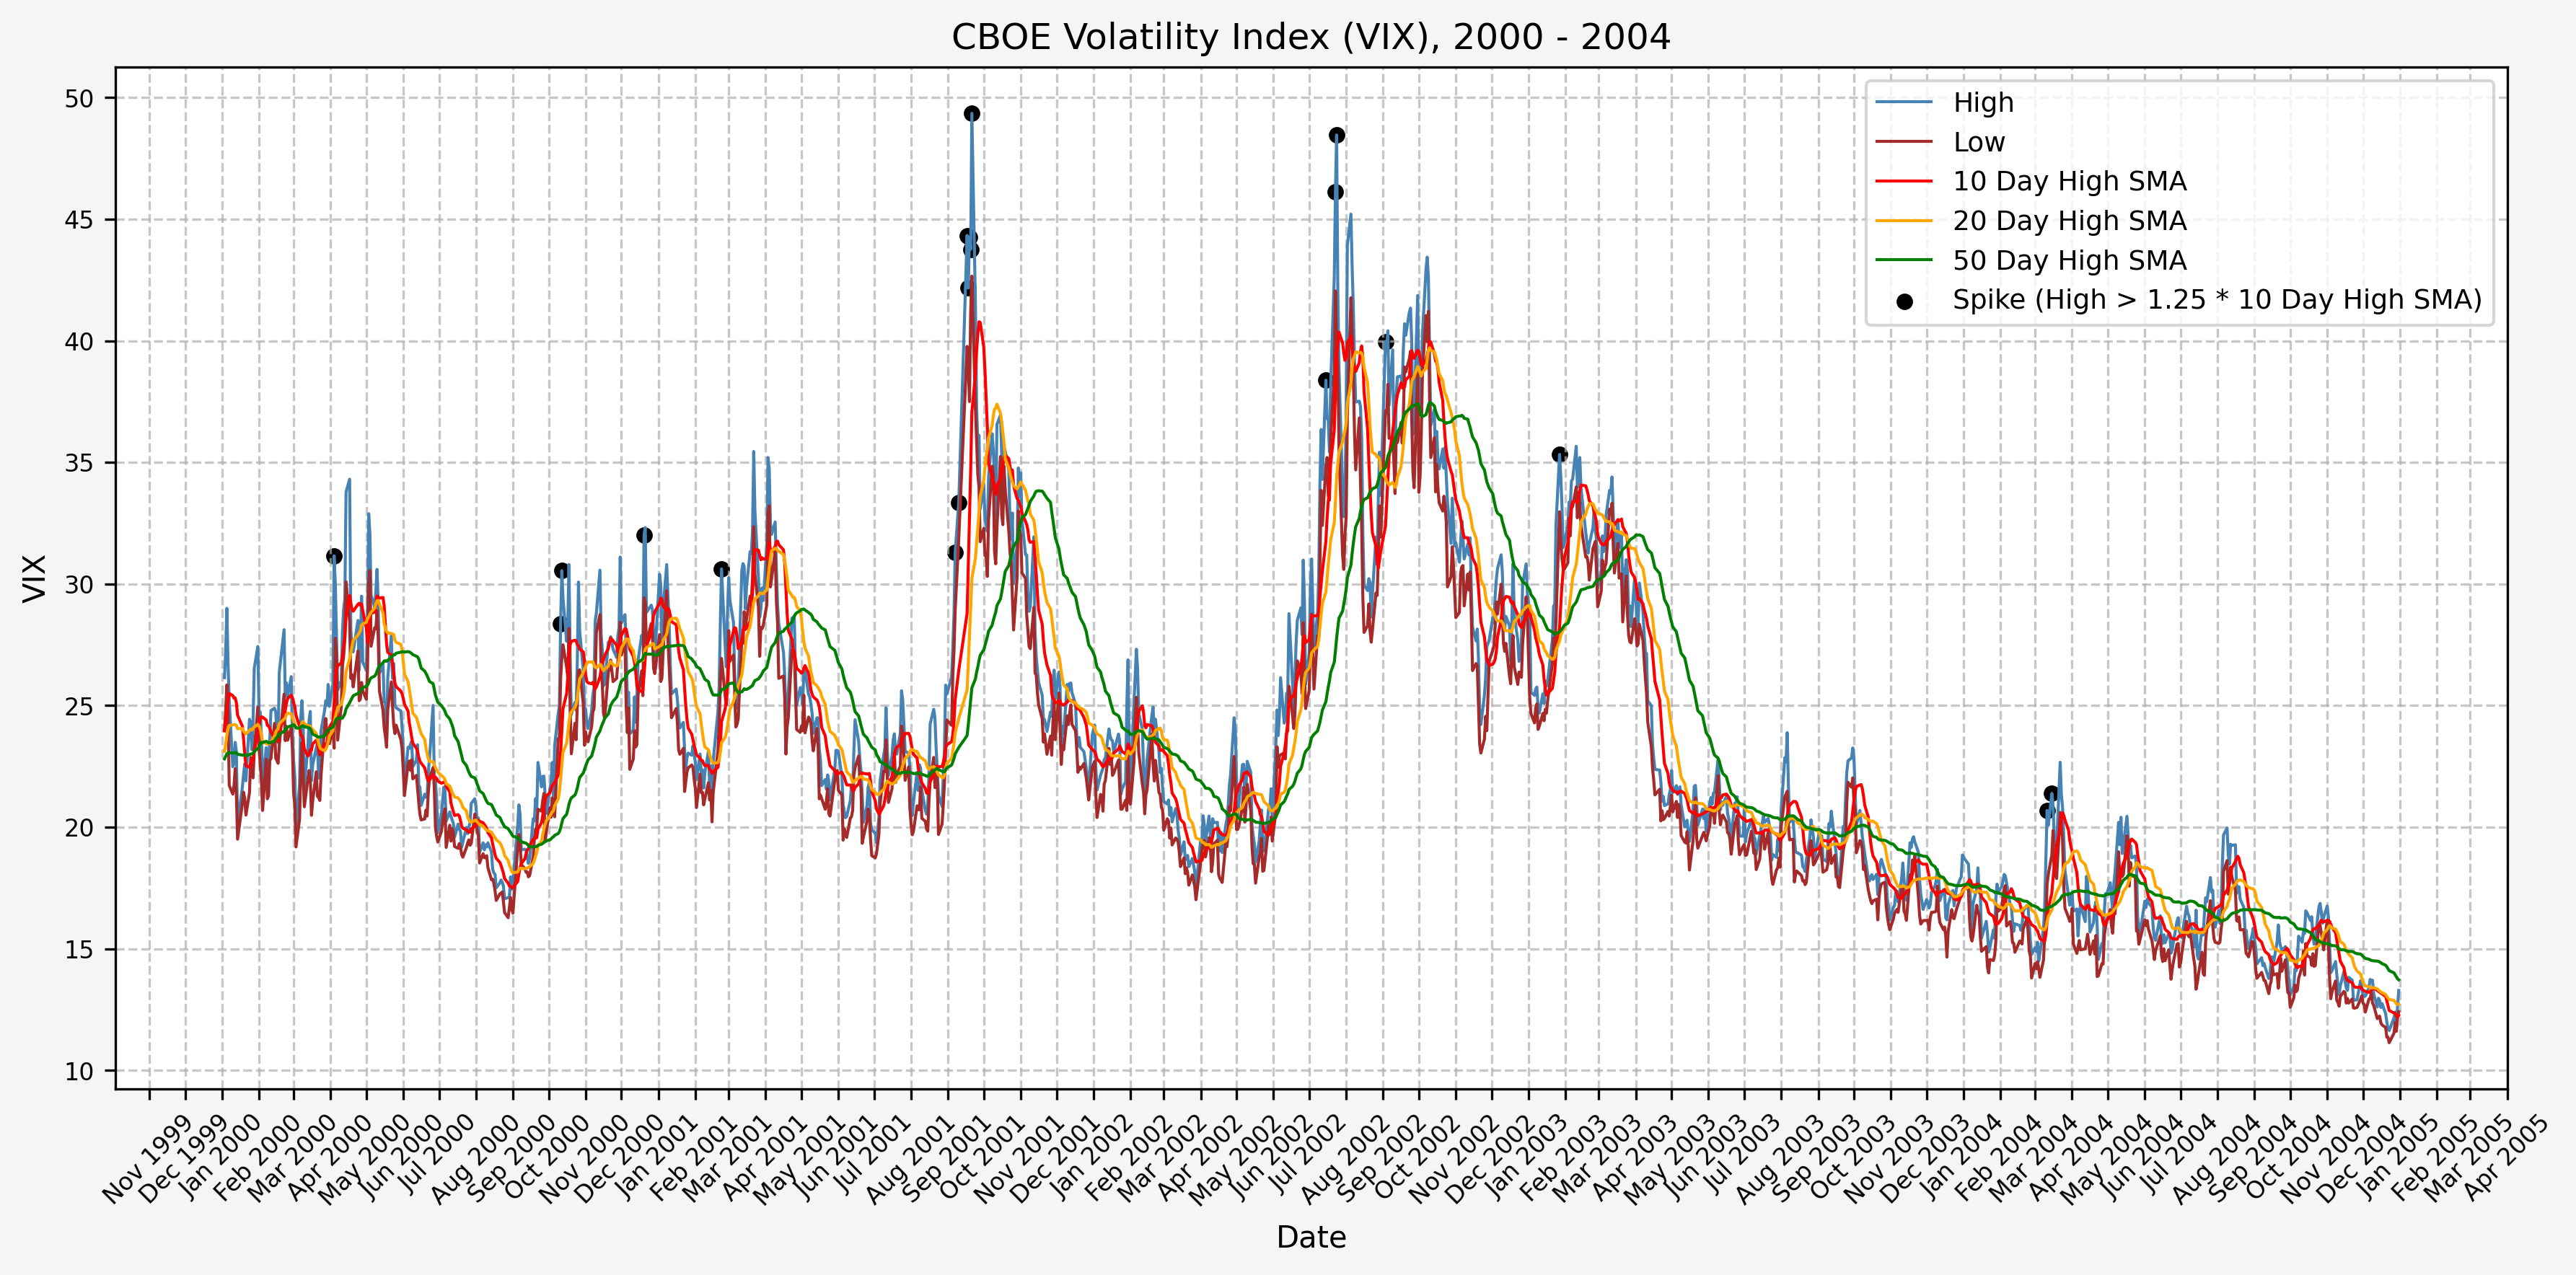
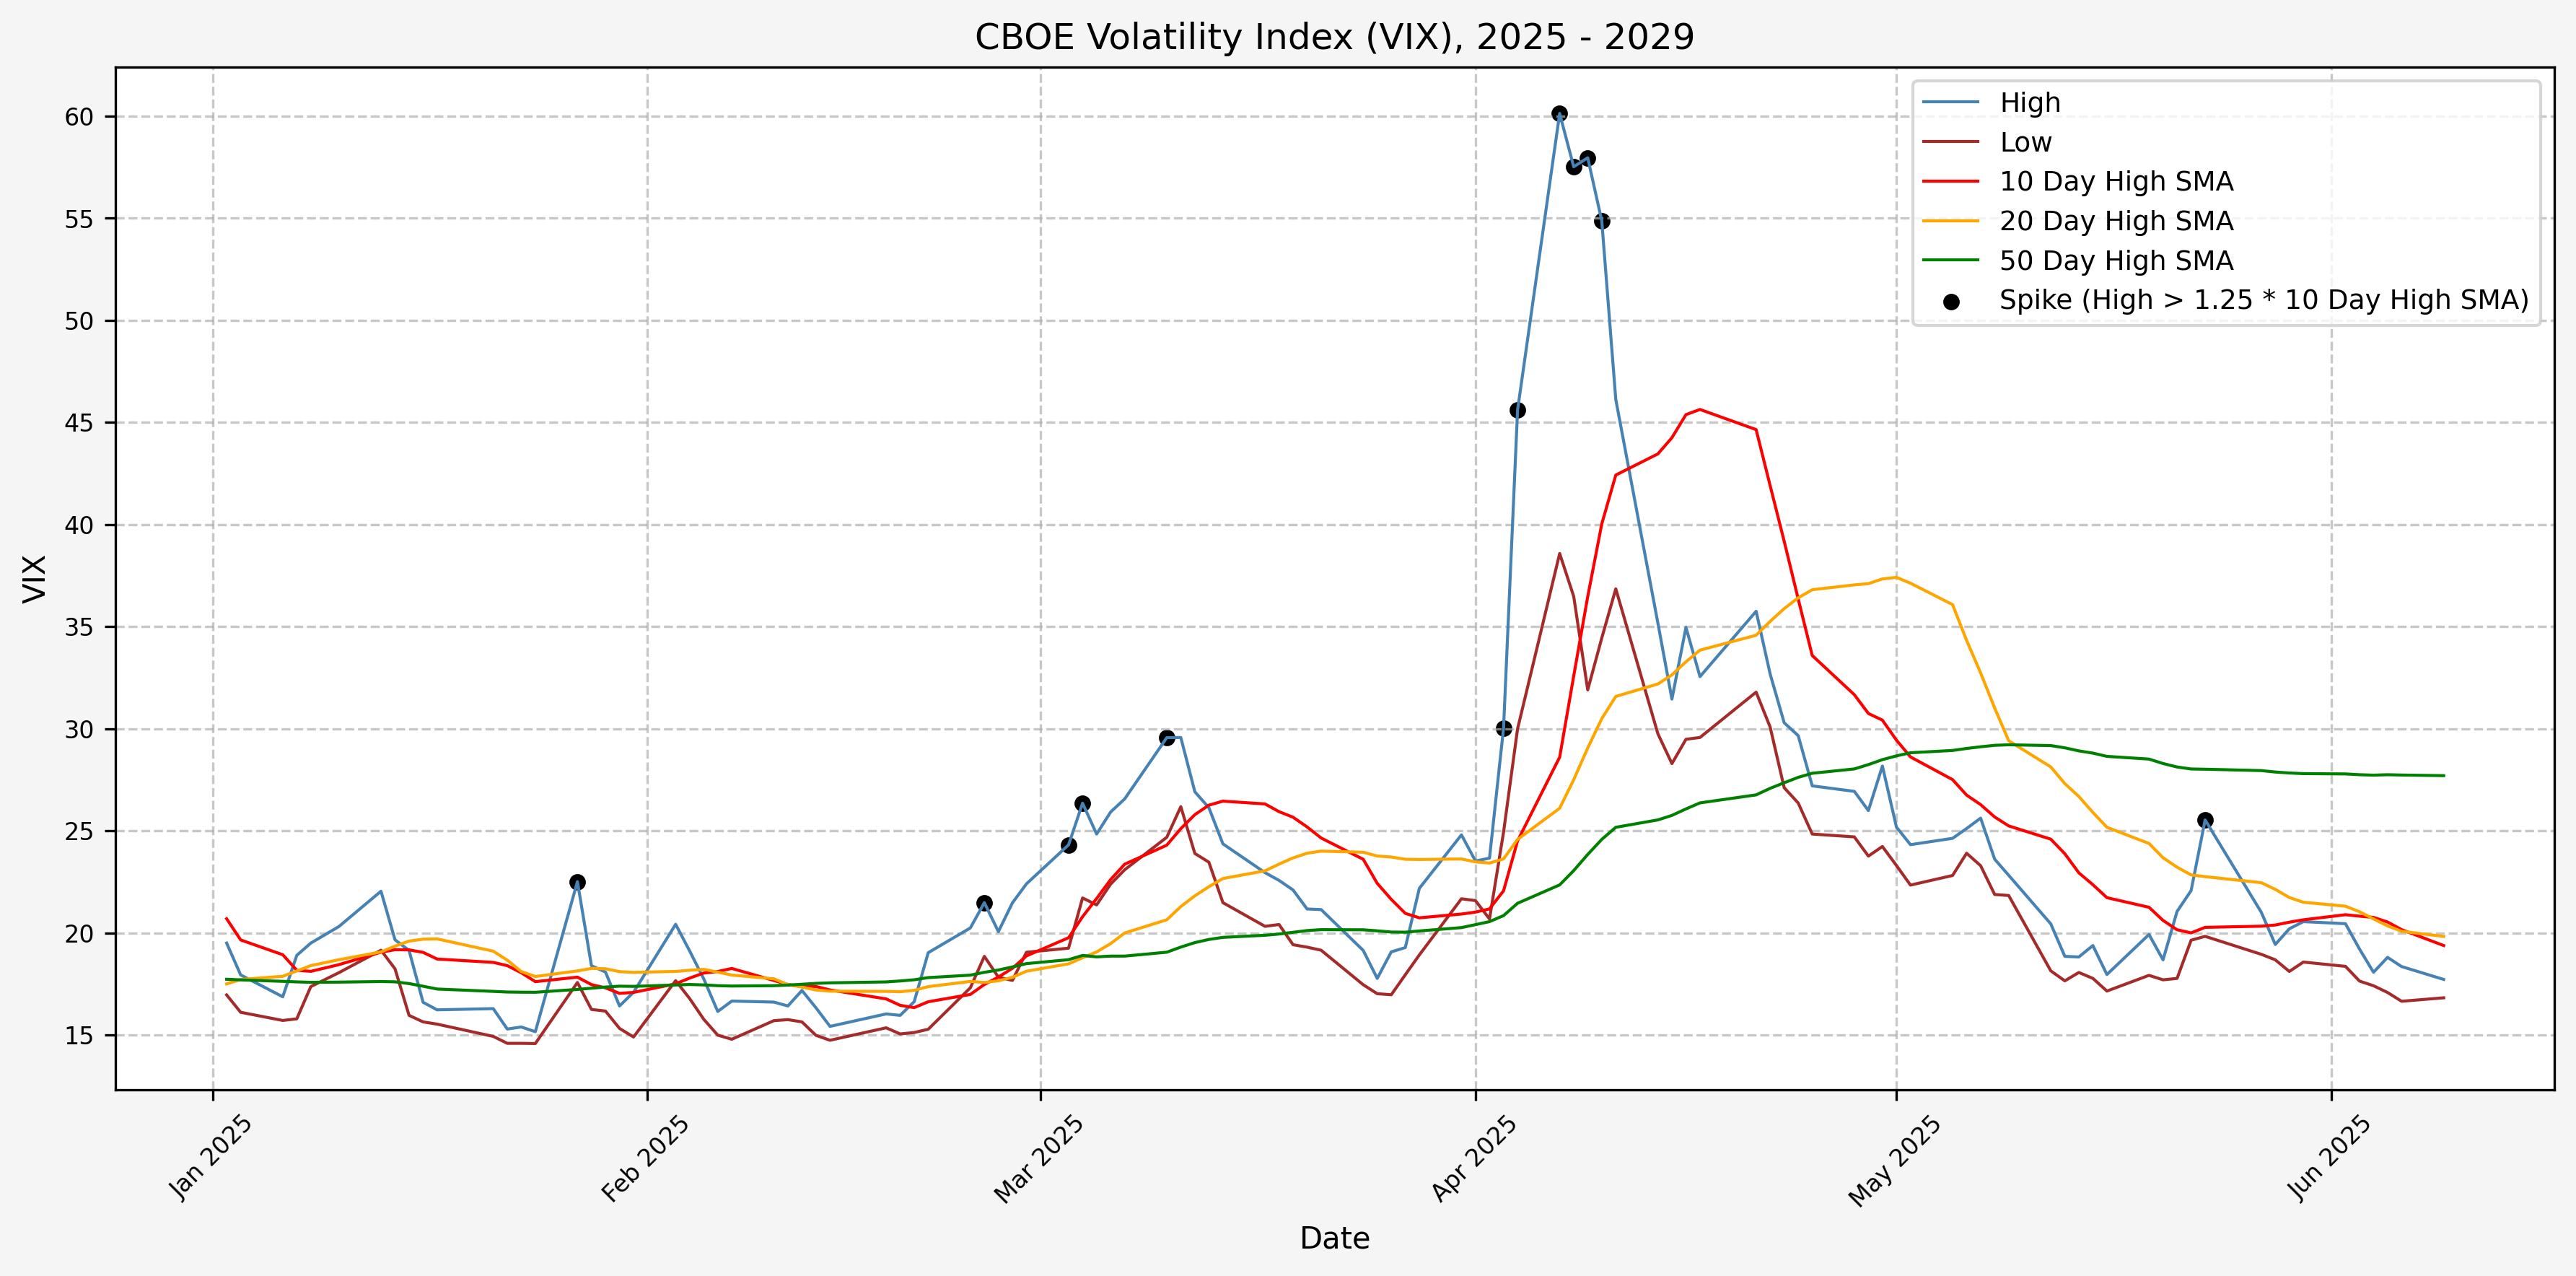
We will start the 10 day simple moving average (SMA) of the daily high level to get an idea of what is happening recently with the VIX. We’ll then pick an arbitrary spike level (25% above the 10 day SMA), and our signal is generated if the VIX hits a level that is above the spike threshold.
The idea is that the 10 day SMA will smooth out the recent short term volatility in the VIX, and therefore any gradual increases in the VIX are not interpreted as spike events.
We also will generate the 20 and 50 day SMAs for reference, and again to see what is happening with the level of the VIX over slightly longer timeframes.
Here’s the code for the above:
| |
For this exercise, we will use simple moving averages.
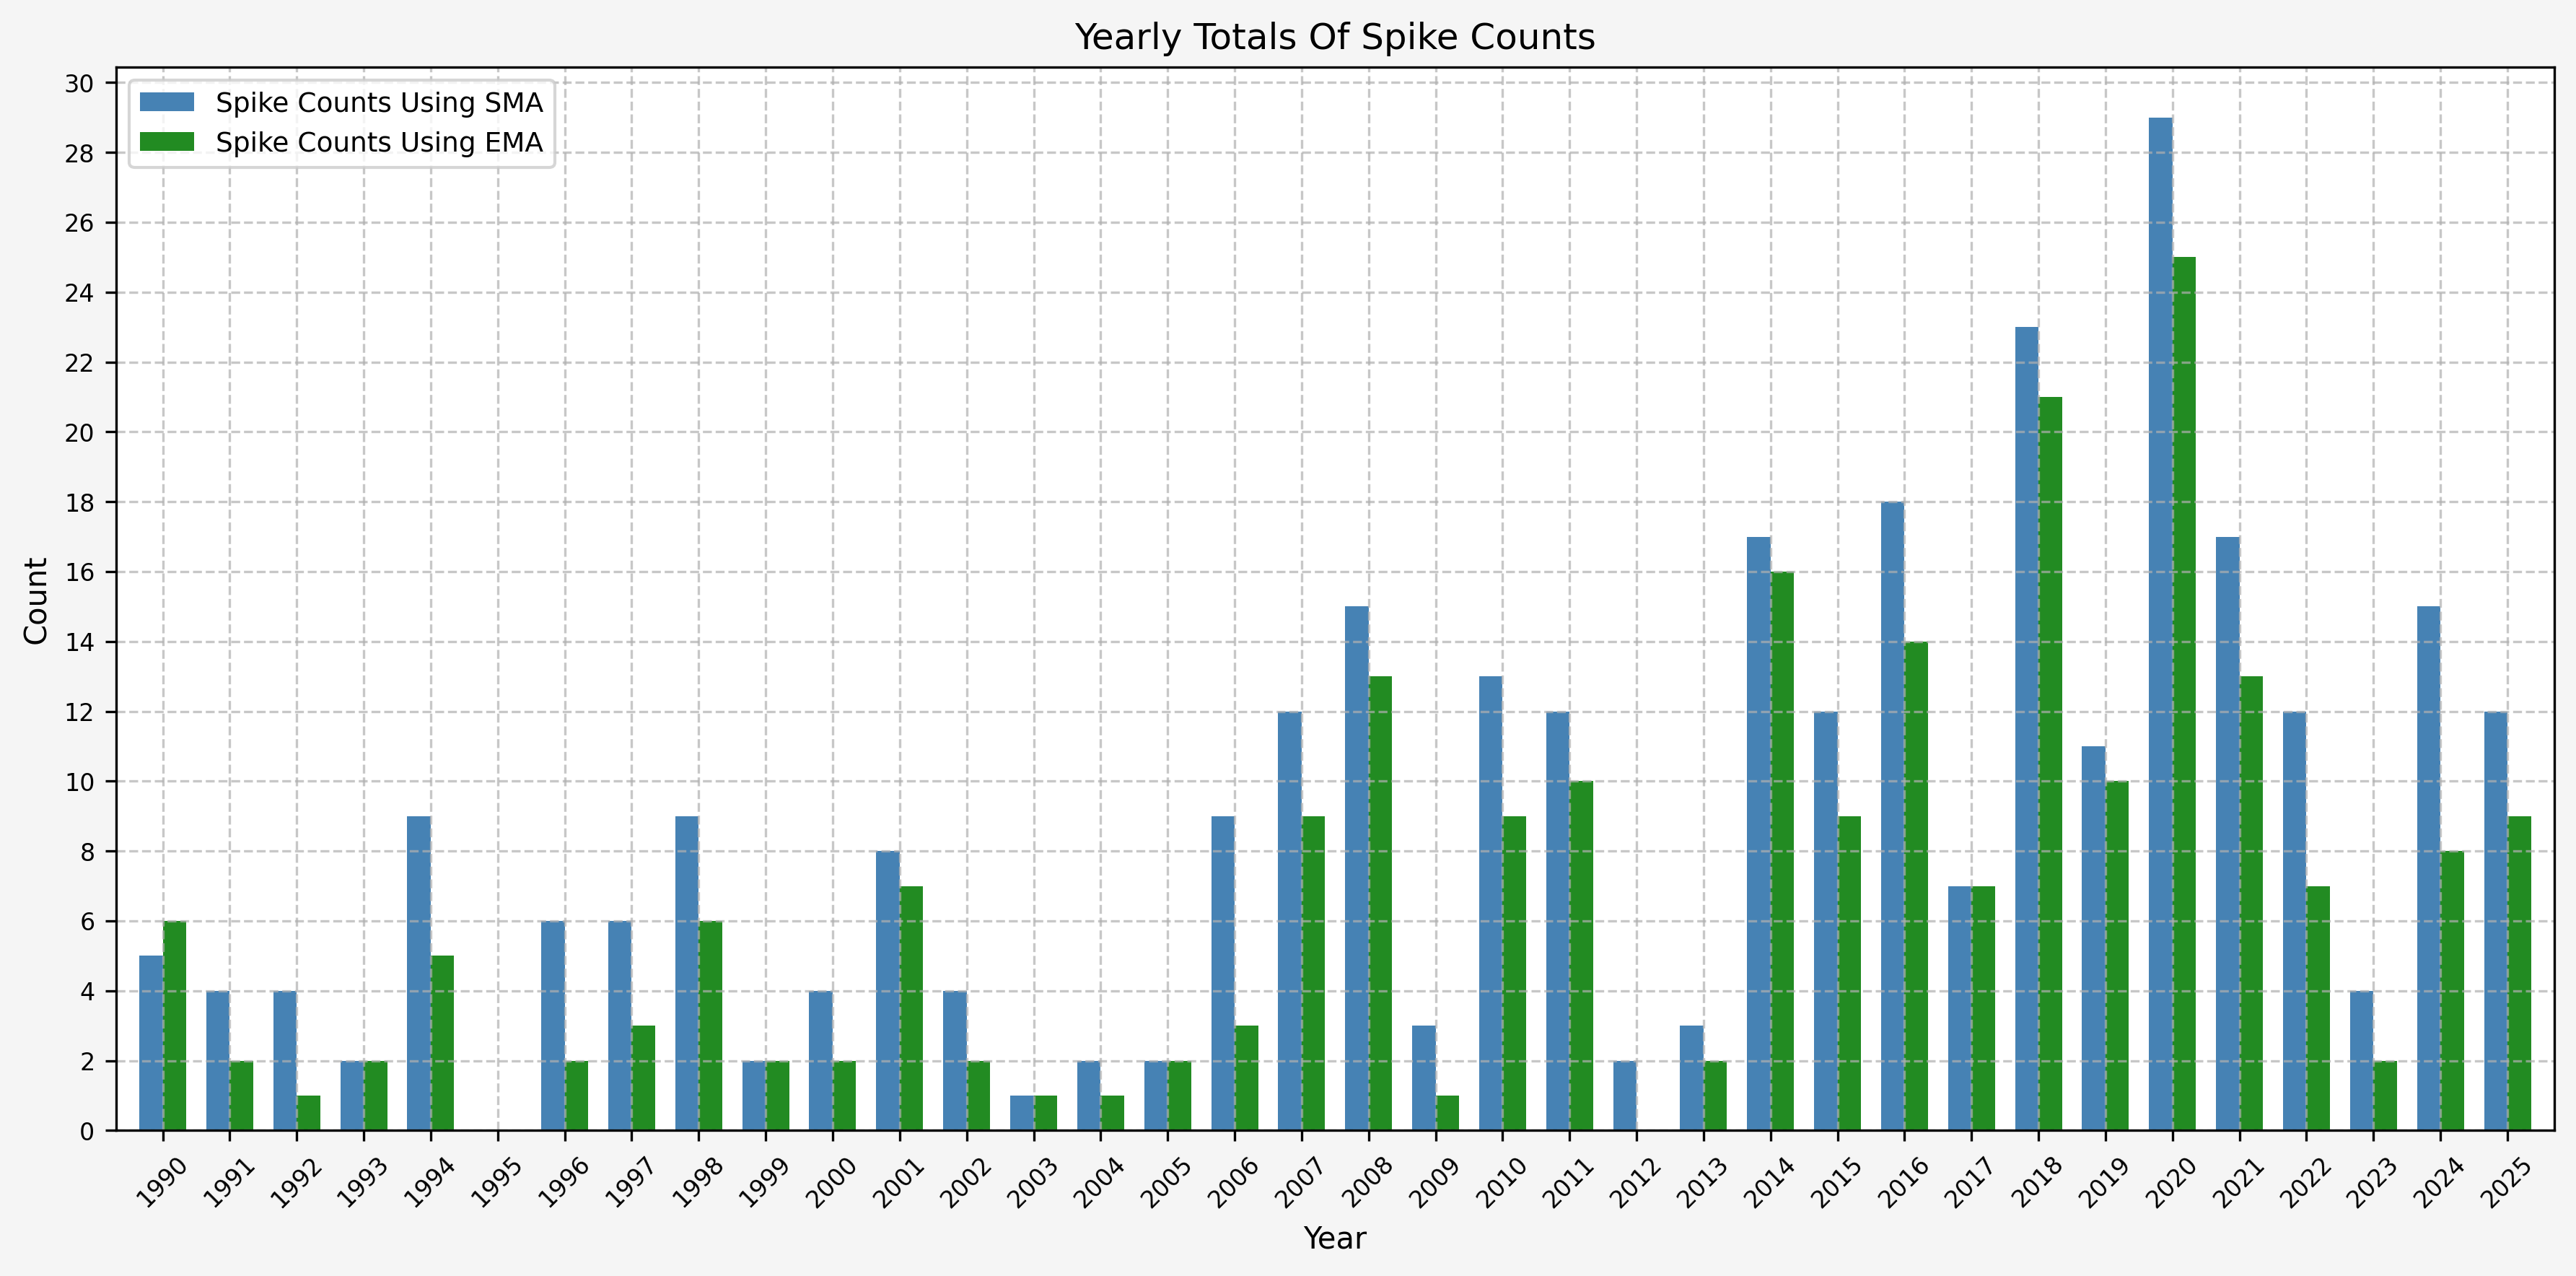
Spike Counts (Signals) By Year
To investigate the number of spike events (or signals) that we receive on a yearly basis, we can run the following:
| |
Which gives us the following:
| Year | False | True |
|---|---|---|
| 1990 | 248 | 5 |
| 1991 | 249 | 4 |
| 1992 | 250 | 4 |
| 1993 | 251 | 2 |
| 1994 | 243 | 9 |
| 1995 | 252 | 0 |
| 1996 | 248 | 6 |
| 1997 | 247 | 6 |
| 1998 | 243 | 9 |
| 1999 | 250 | 2 |
| 2000 | 248 | 4 |
| 2001 | 240 | 8 |
| 2002 | 248 | 4 |
| 2003 | 251 | 1 |
| 2004 | 250 | 2 |
| 2005 | 250 | 2 |
| 2006 | 242 | 9 |
| 2007 | 239 | 12 |
| 2008 | 238 | 15 |
| 2009 | 249 | 3 |
| 2010 | 239 | 13 |
| 2011 | 240 | 12 |
| 2012 | 248 | 2 |
| 2013 | 249 | 3 |
| 2014 | 235 | 17 |
| 2015 | 240 | 12 |
| 2016 | 234 | 18 |
| 2017 | 244 | 7 |
| 2018 | 228 | 23 |
| 2019 | 241 | 11 |
| 2020 | 224 | 29 |
| 2021 | 235 | 17 |
| 2022 | 239 | 12 |
| 2023 | 246 | 4 |
| 2024 | 237 | 15 |
| 2025 | 203 | 17 |
And the plot to aid with visualization. Based on the plot, it seems as though volatility has increased since the early 2000’s:
Spike Counts (Signals) Plots By Year
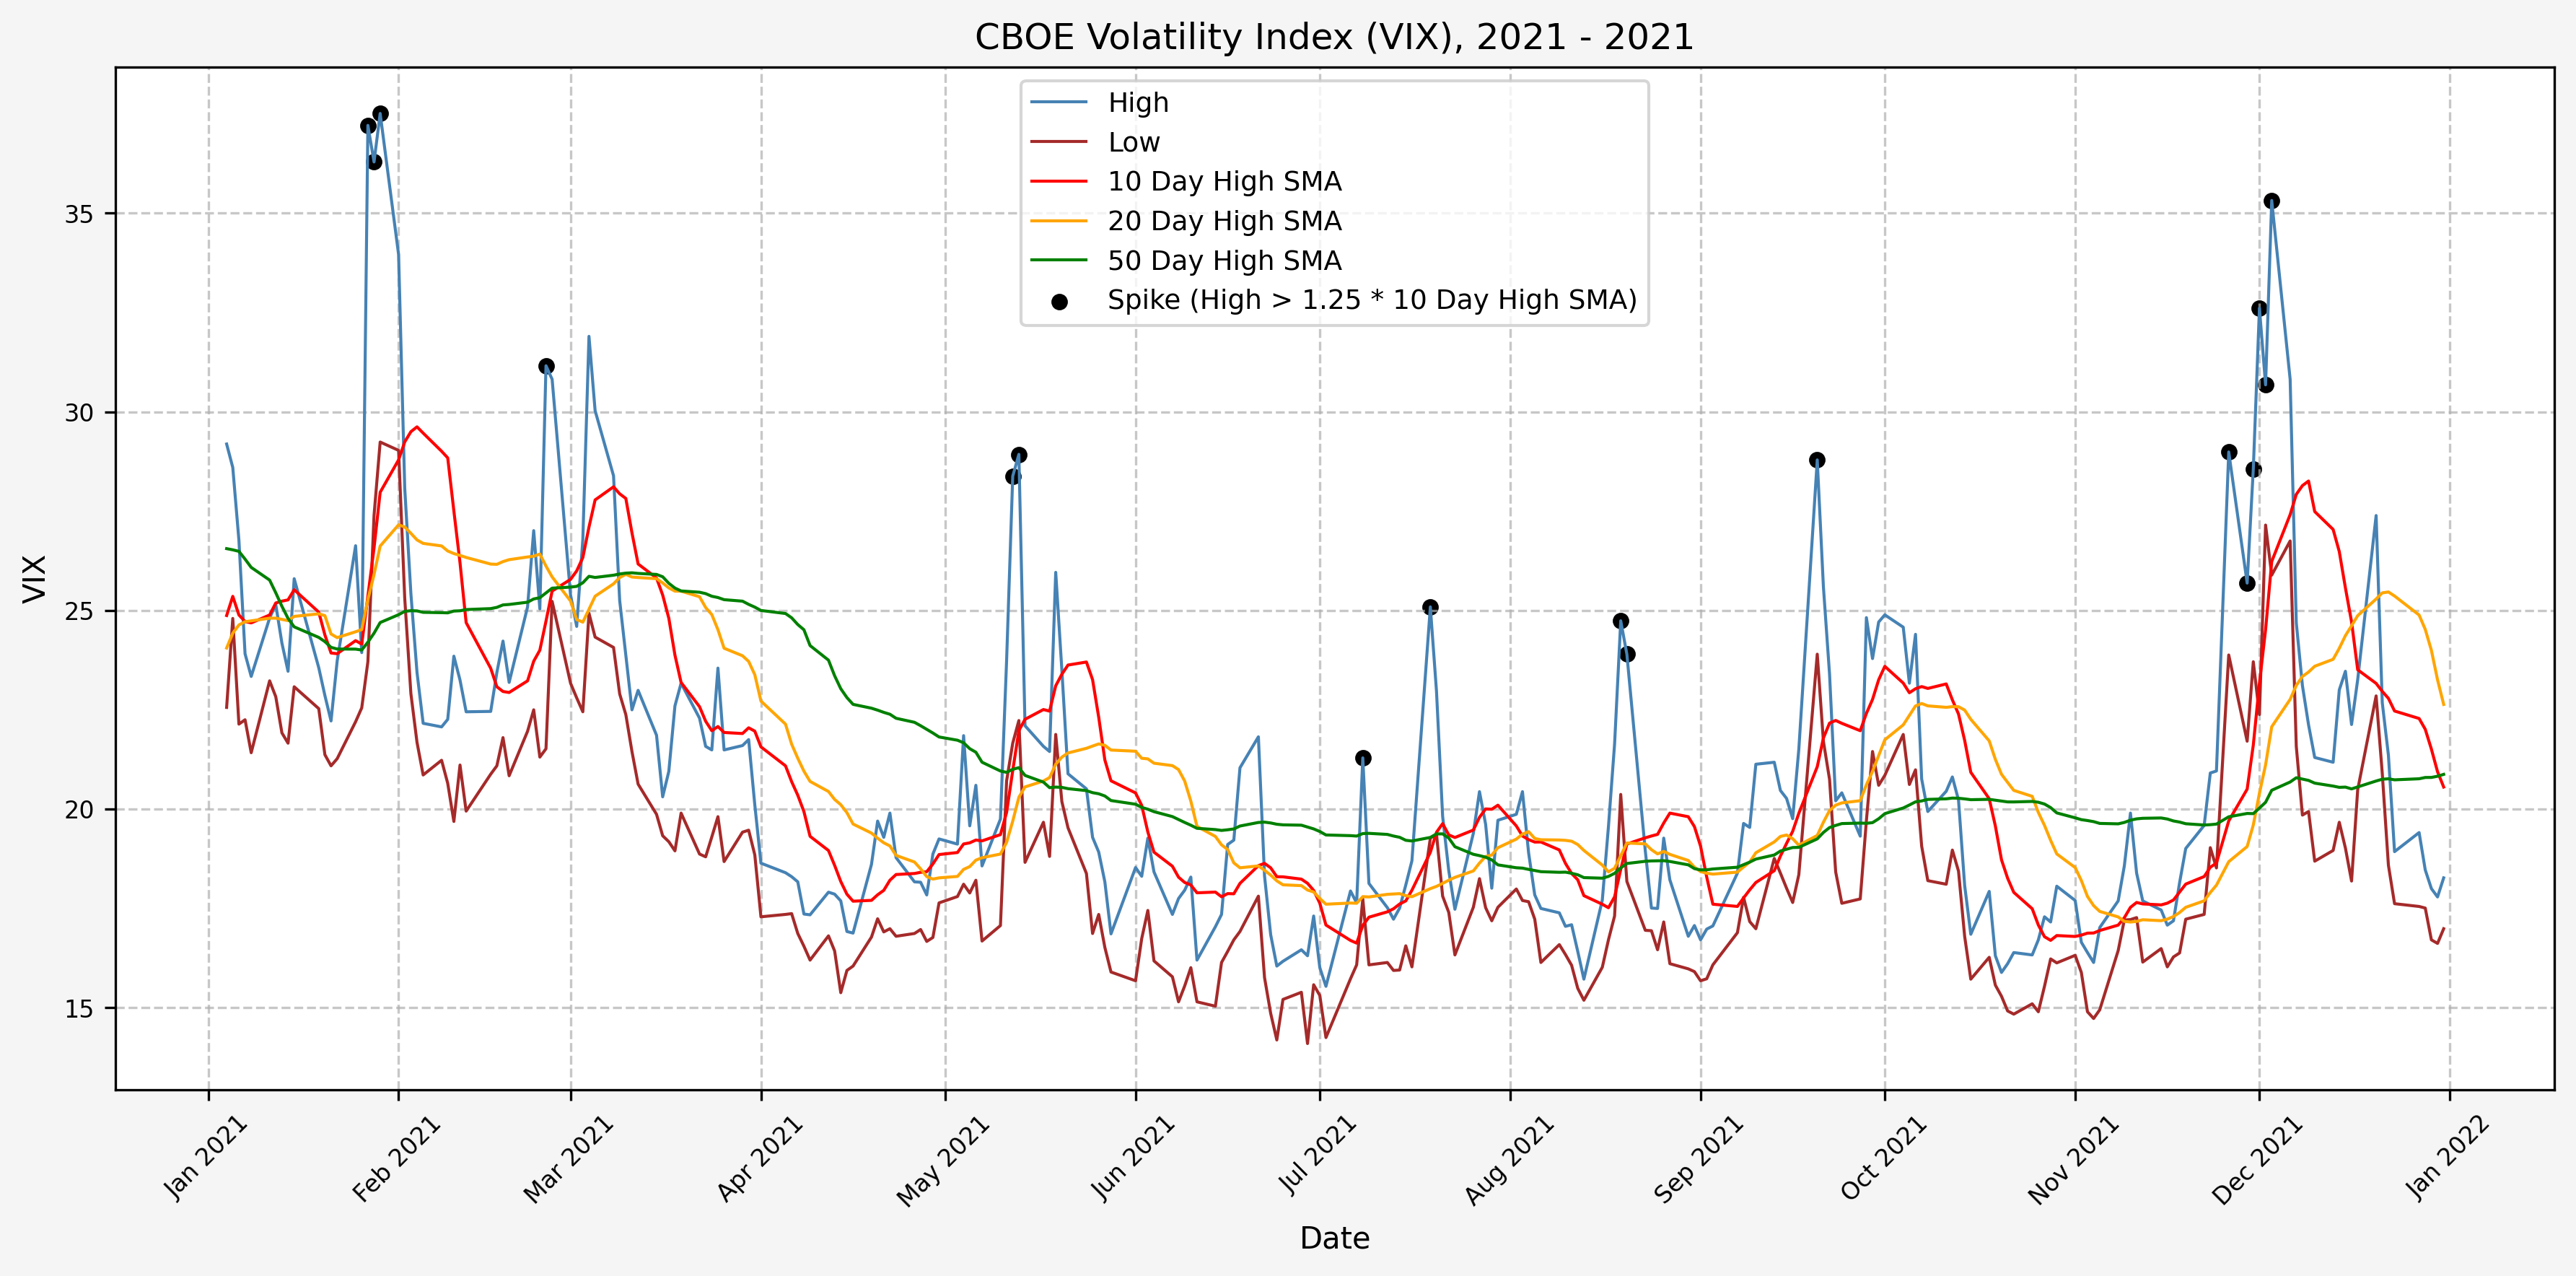
The most recent yearly plots are shown below for when signals are generated. The images for the previous years are linked below.
Spike/Signals, 1990Spike/Signals, 1991Spike/Signals, 1992Spike/Signals, 1993Spike/Signals, 1994Spike/Signals, 1995Spike/Signals, 1996Spike/Signals, 1997Spike/Signals, 1998Spike/Signals, 1999Spike/Signals, 2000Spike/Signals, 2001Spike/Signals, 2002Spike/Signals, 2003Spike/Signals, 2004Spike/Signals, 2005Spike/Signals, 2006Spike/Signals, 2007Spike/Signals, 2008Spike/Signals, 2009Spike/Signals, 2010Spike/Signals, 2011Spike/Signals, 2012Spike/Signals, 2013Spike/Signals, 2014Spike/Signals, 2015Spike/Signals, 2016Spike/Signals, 2017Spike/Signals, 2018Spike/Signals, 2019
2020
2021
2022
2023
2024
2025
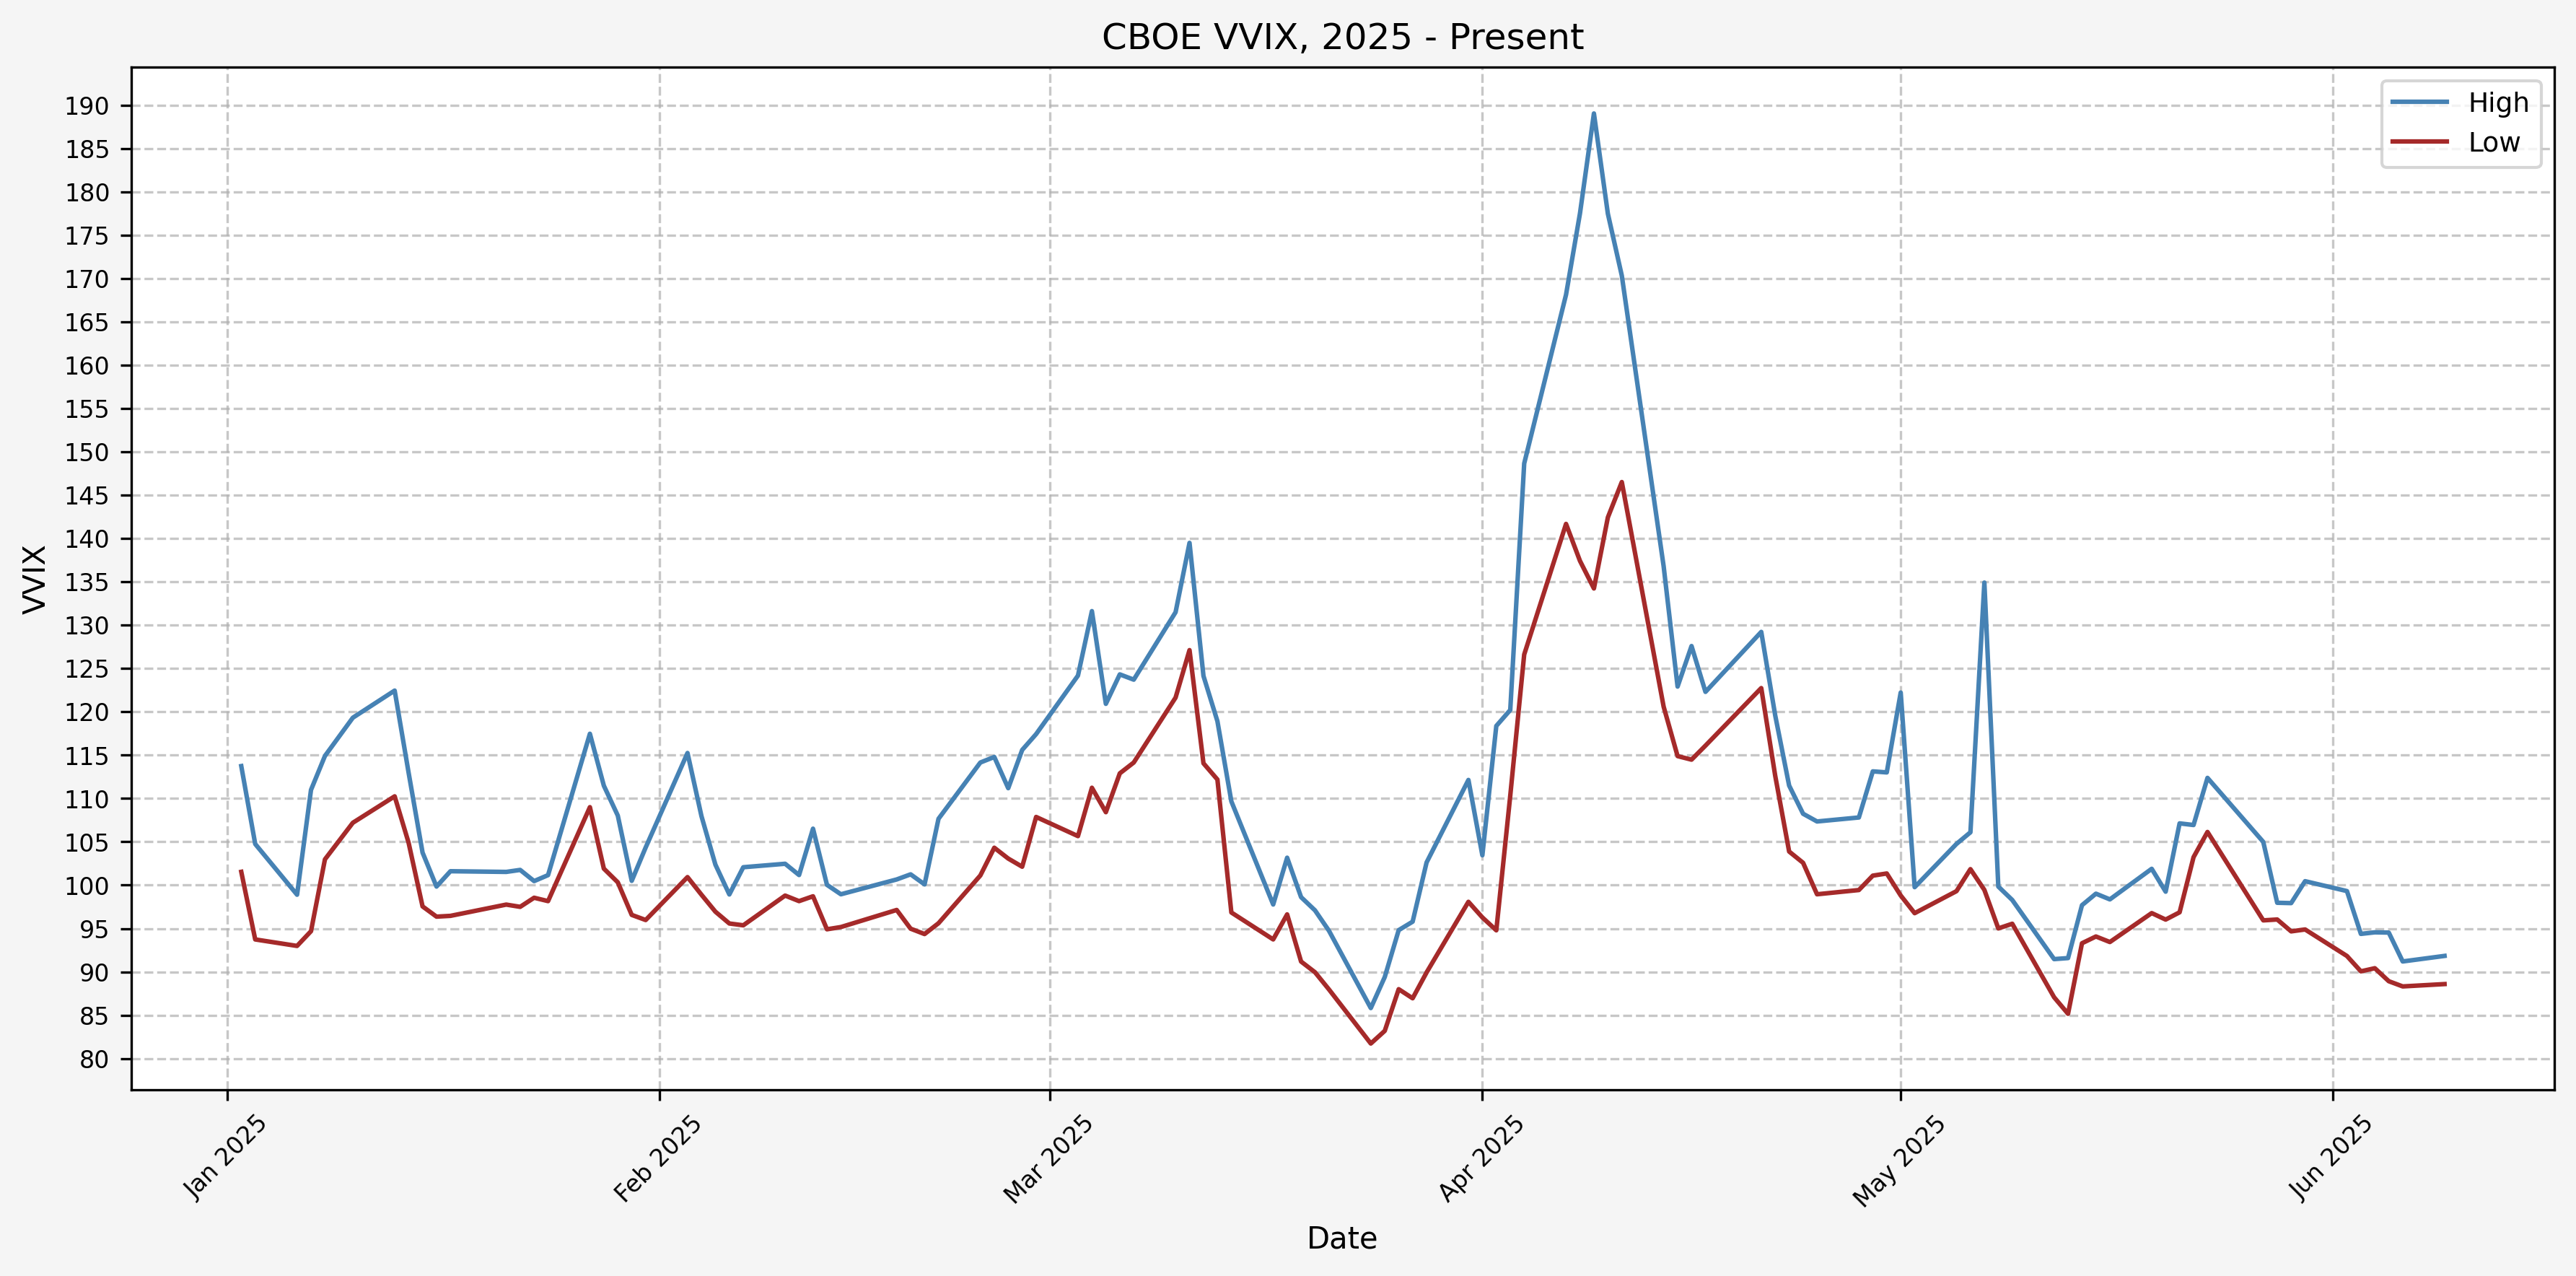
For comparison with the VVIX plot for 2025:
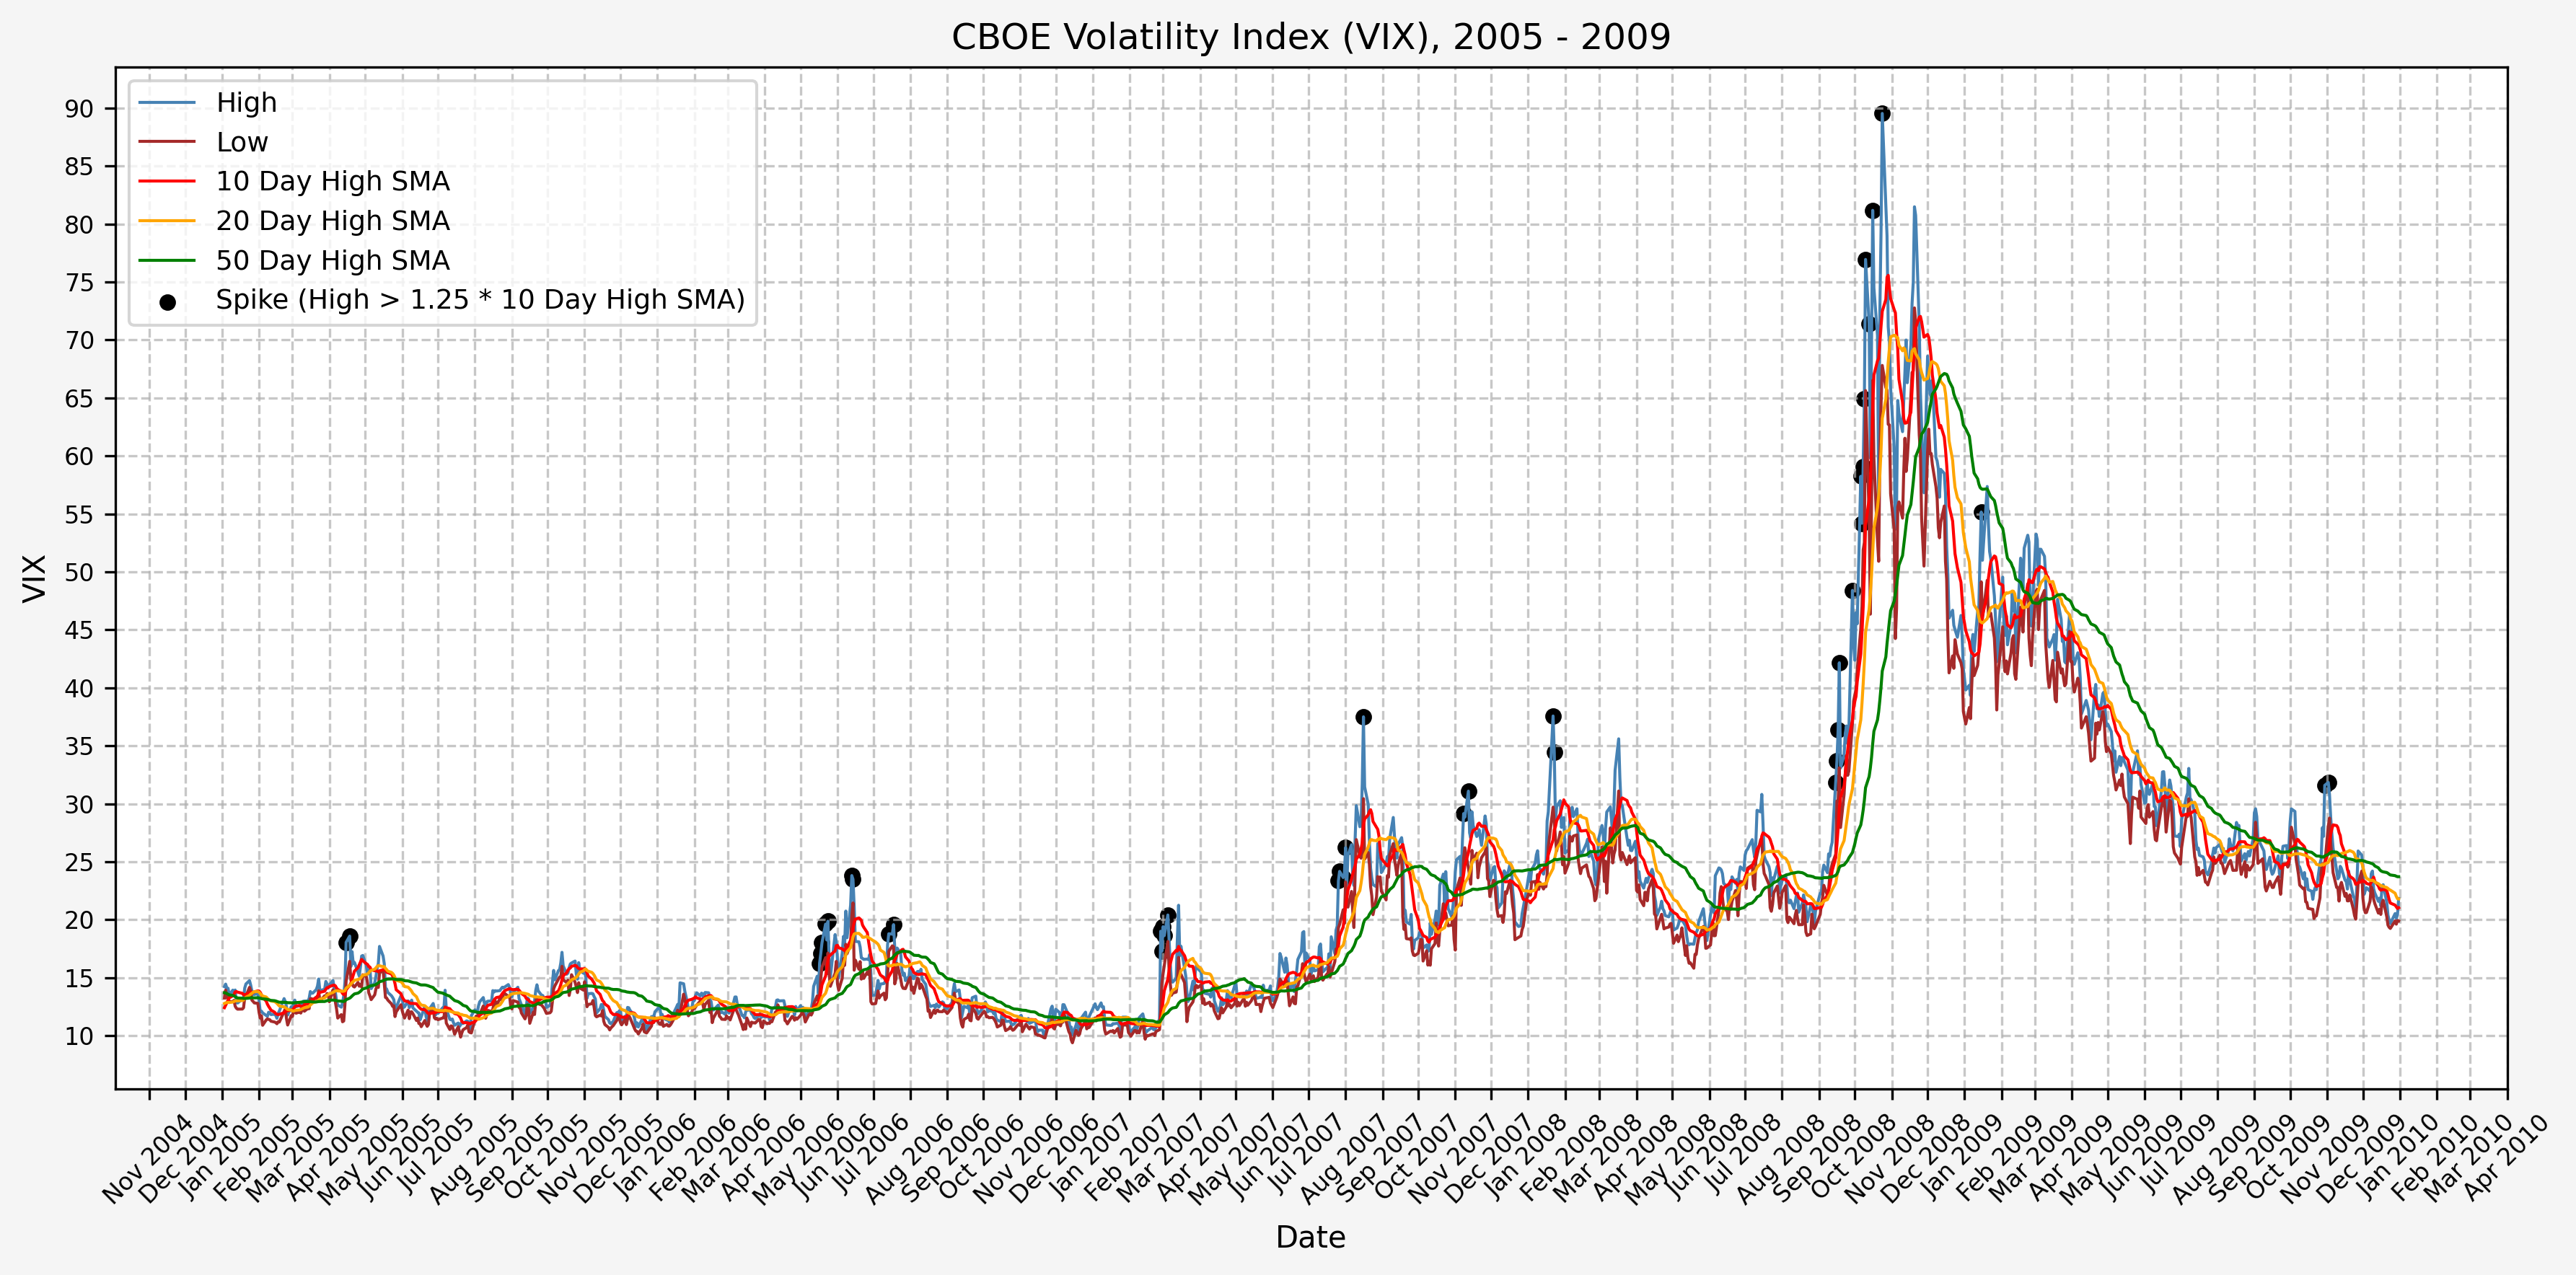
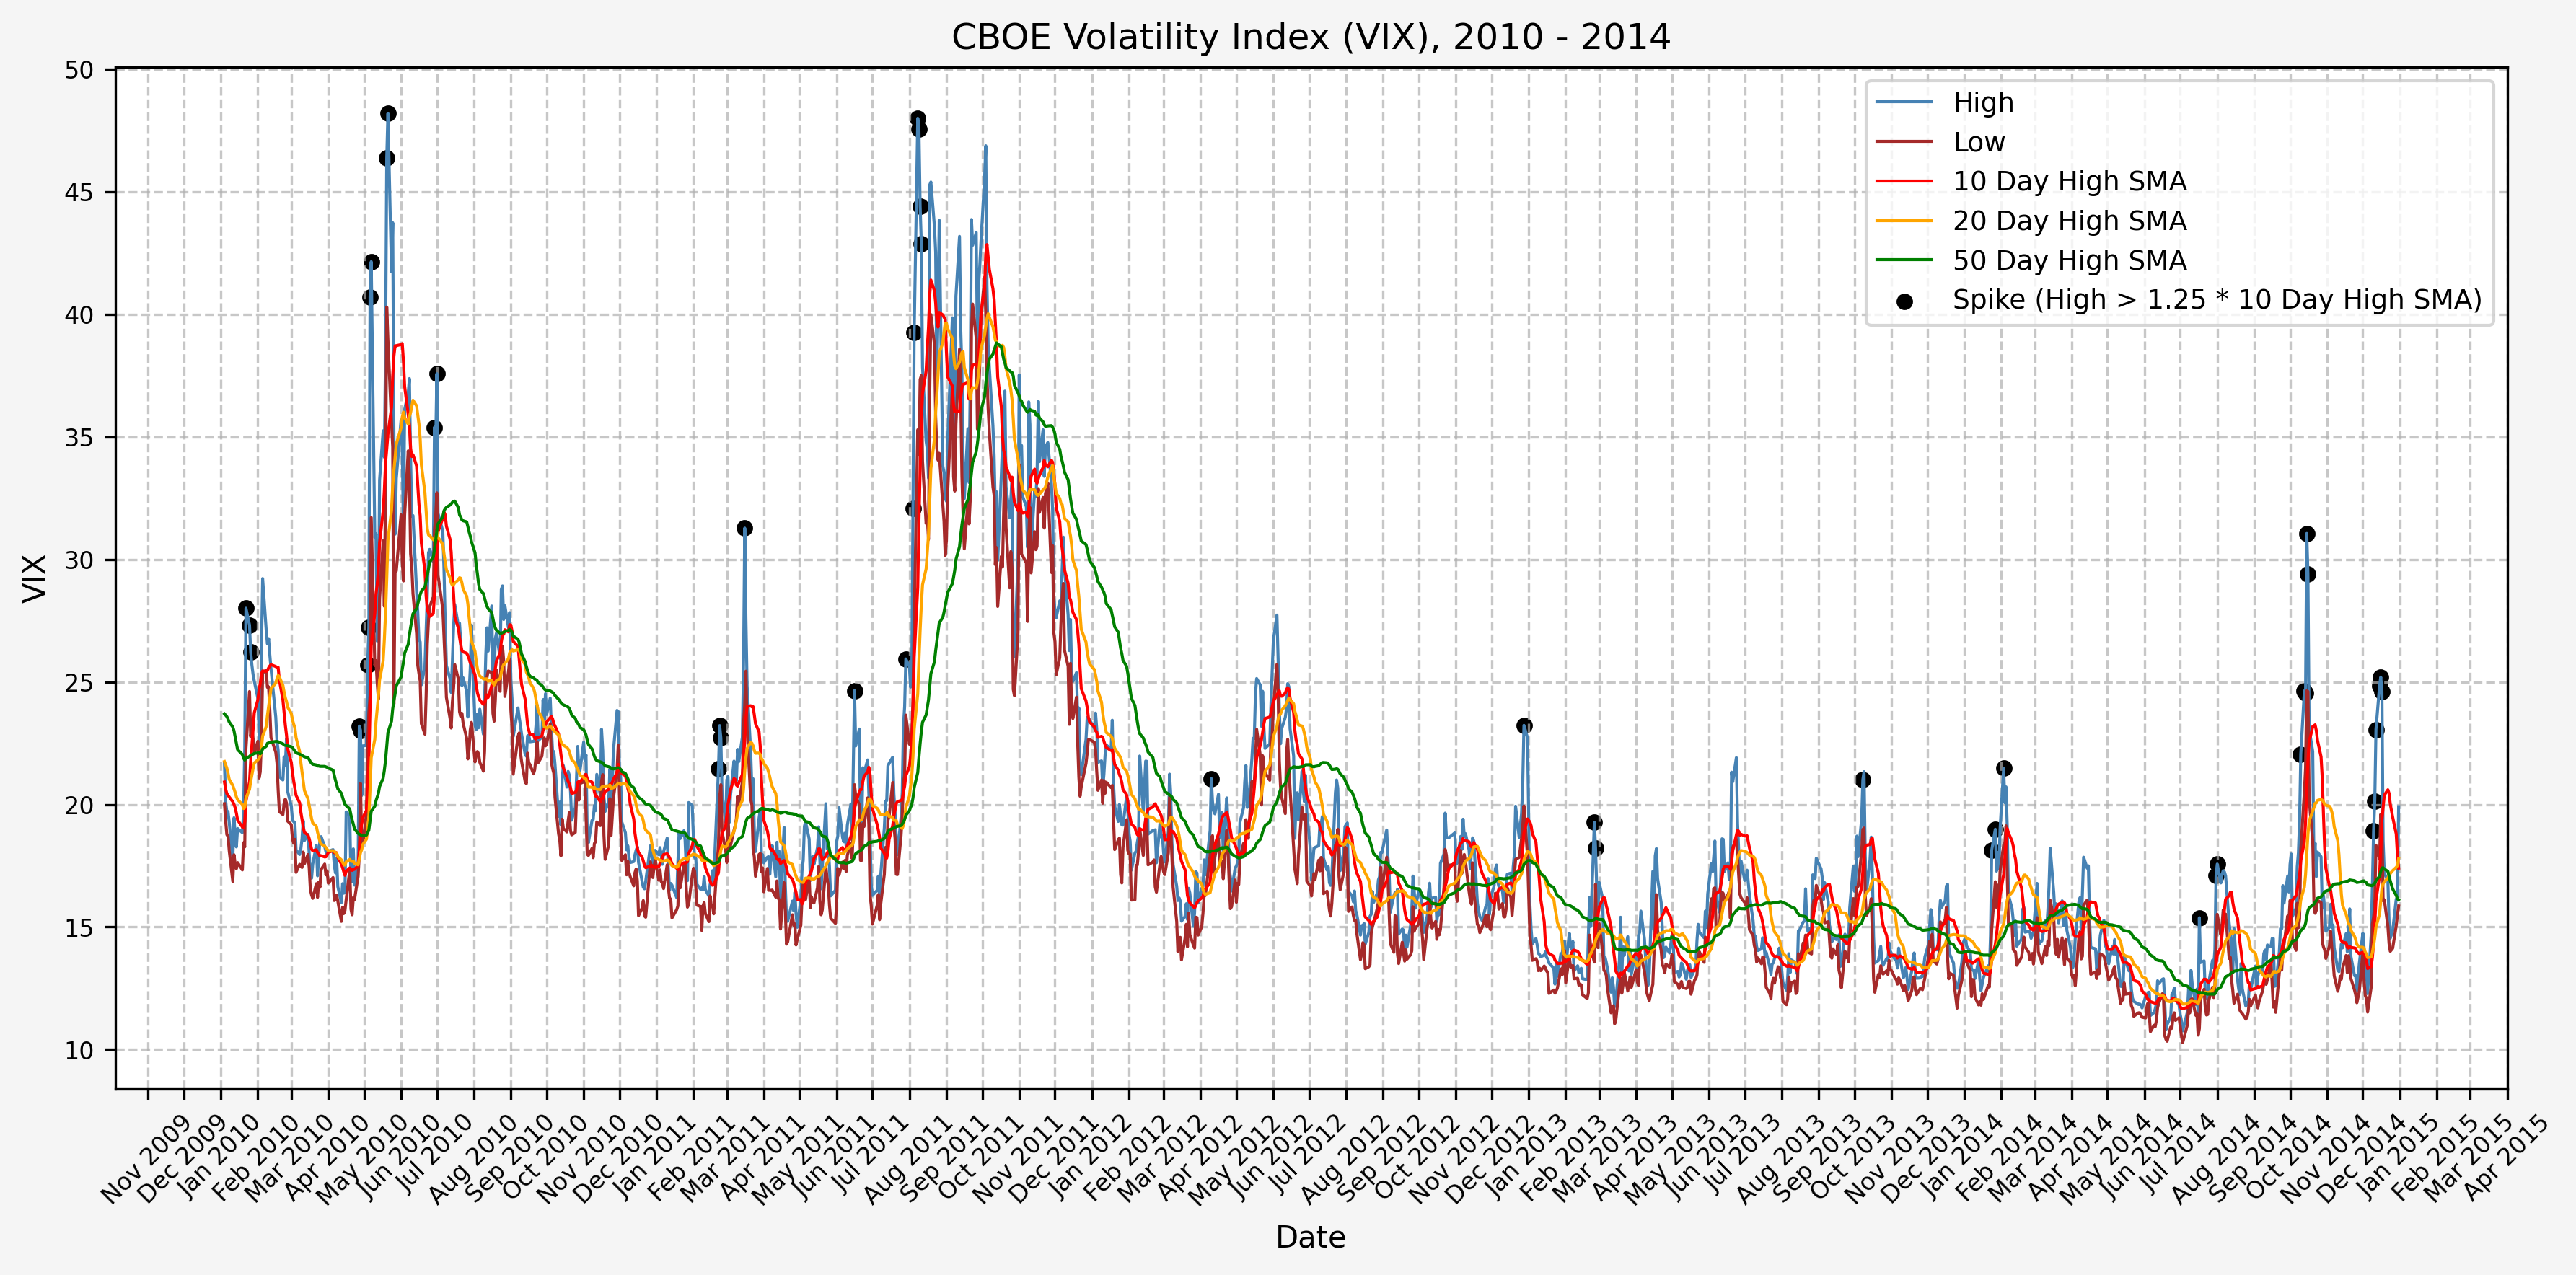
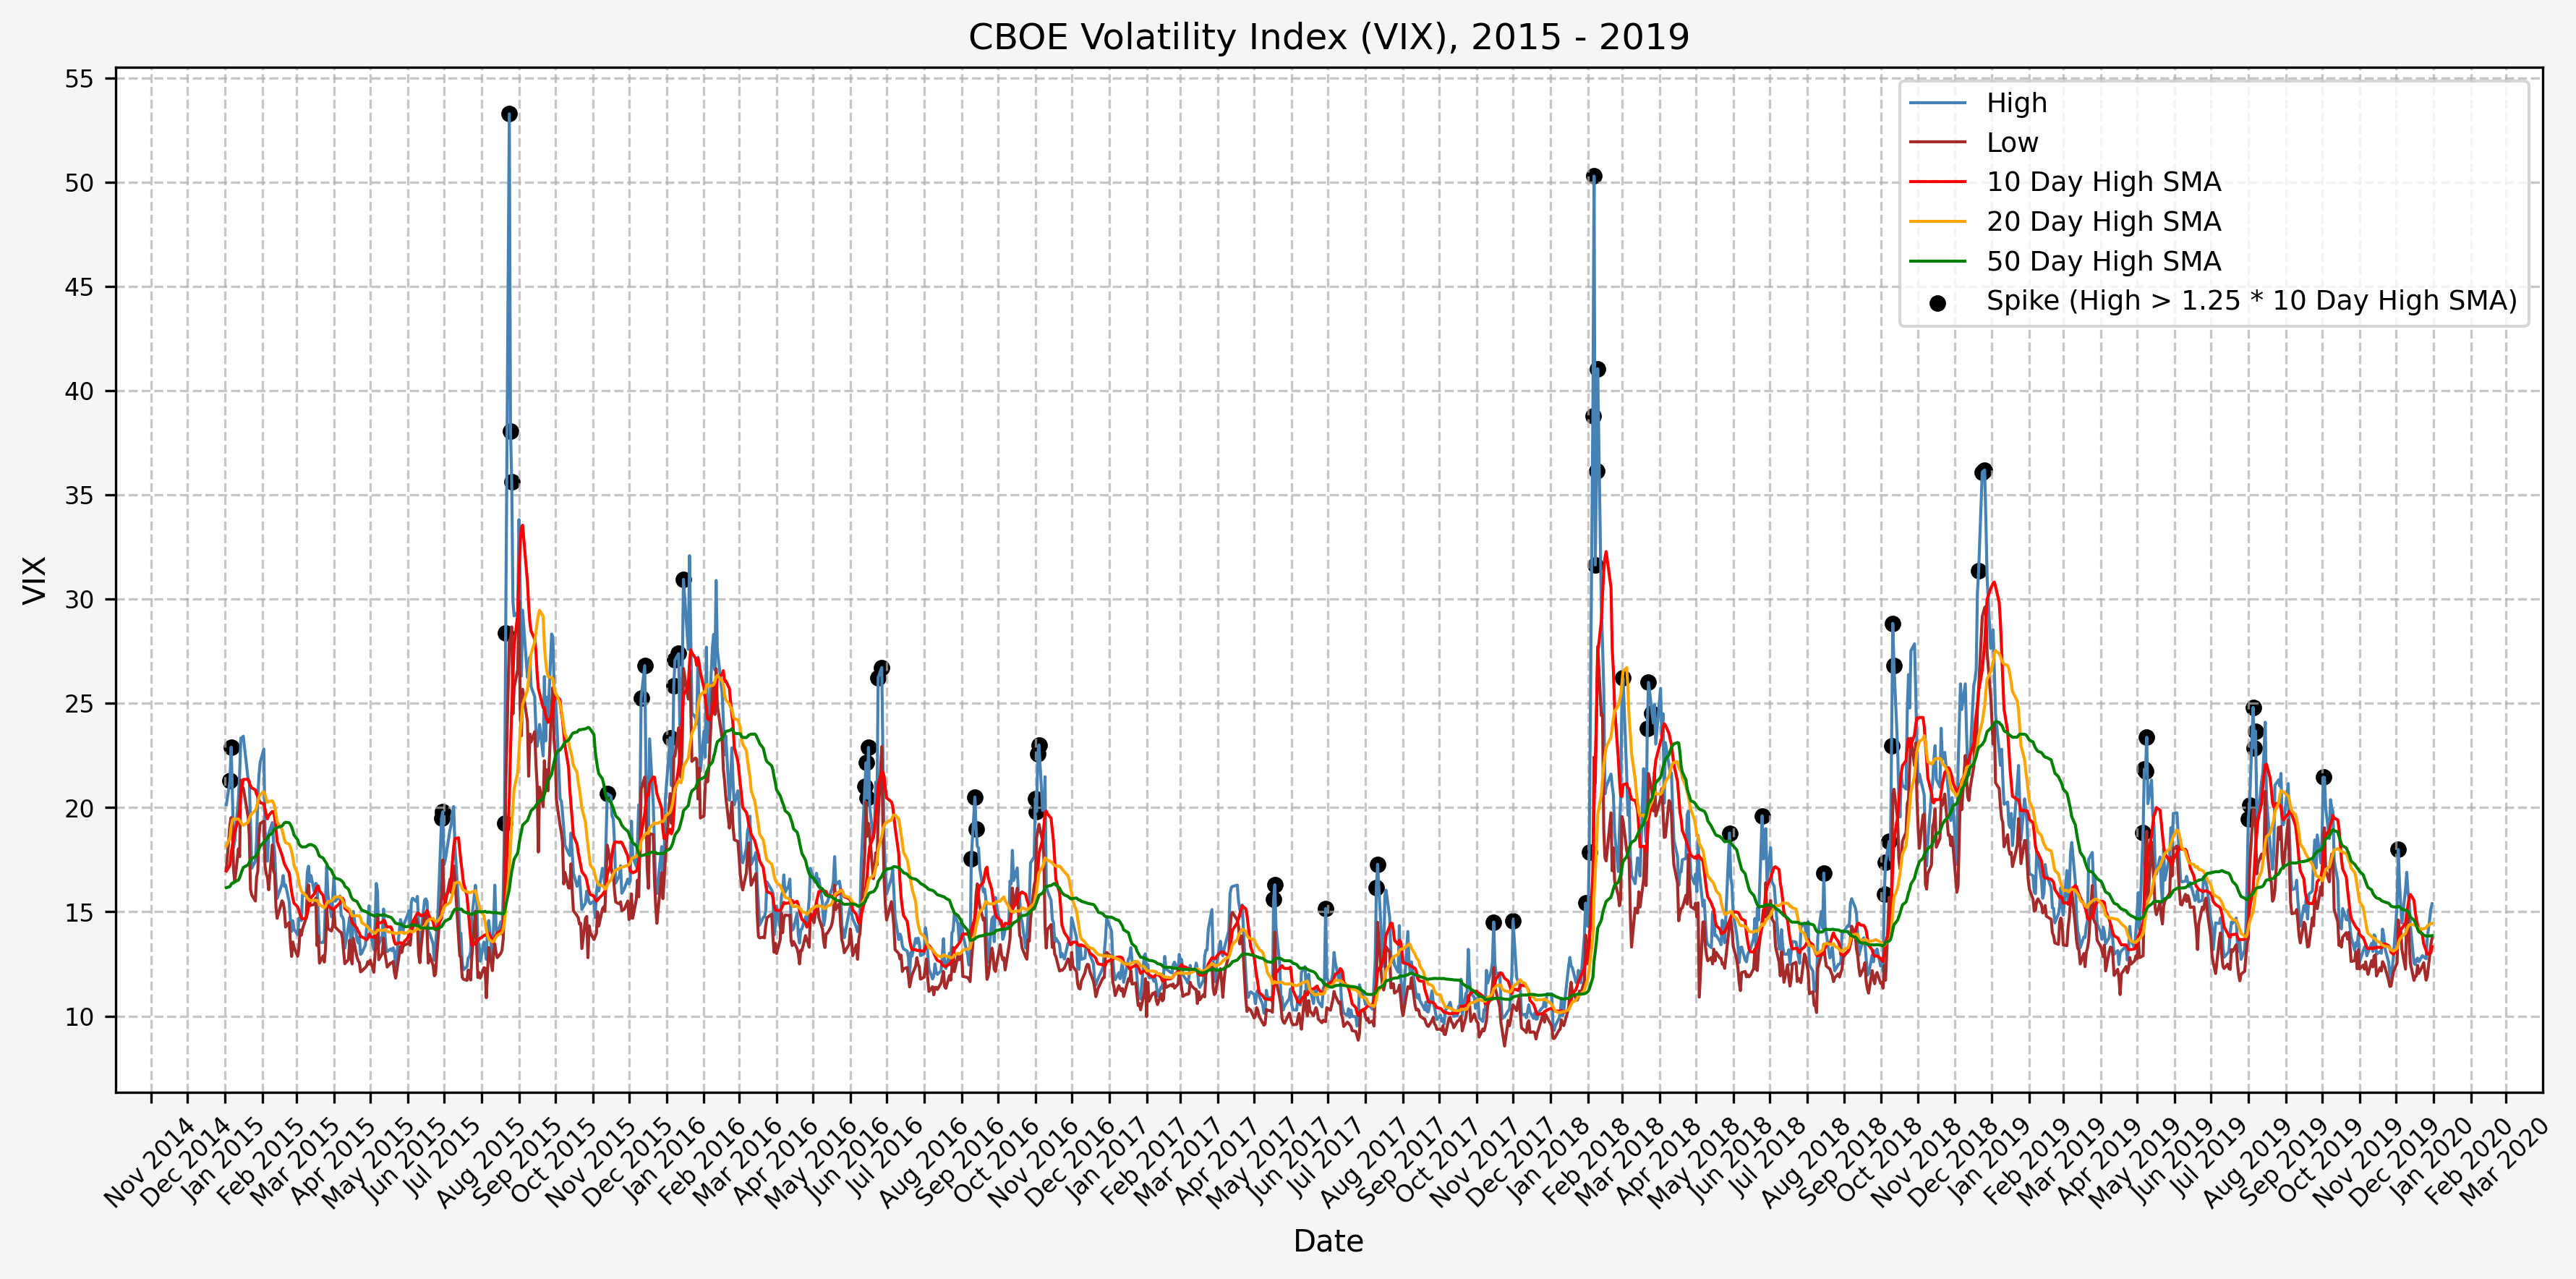
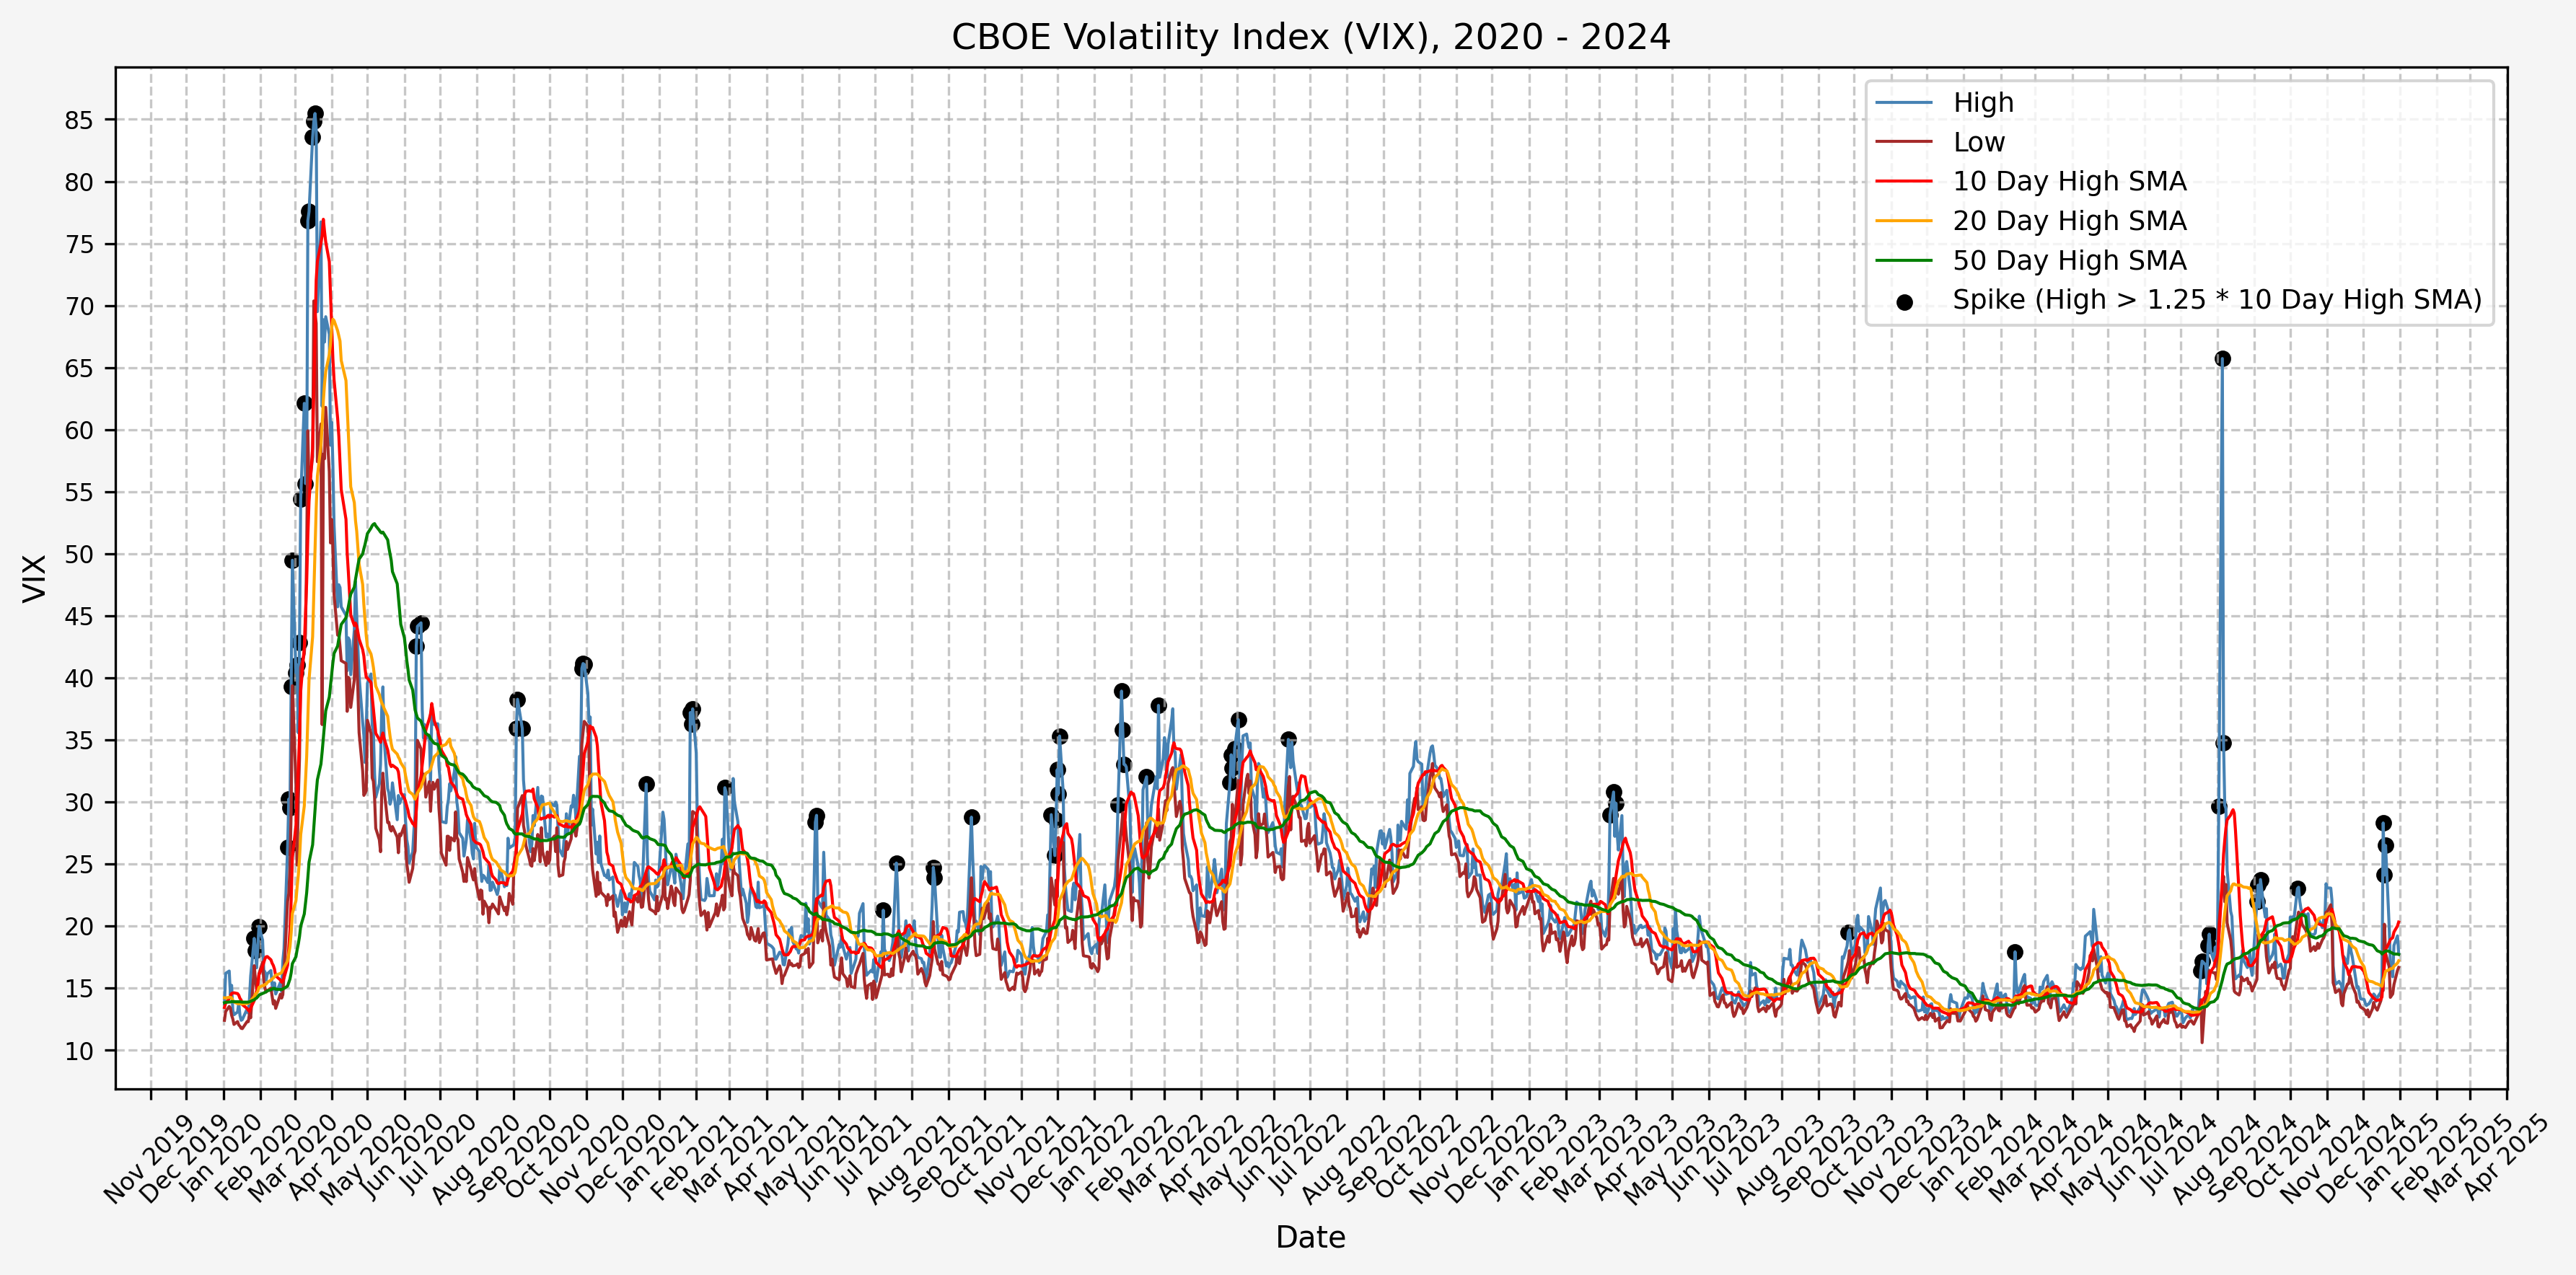
Spike Counts (Signals) Plots By Decade
And here are the plots for the signals generated over the past 3 decades:
1990 - 1994
1995 - 1999
2000 - 2004
2005 - 2009
2010 - 2014
2015 - 2019
2020 - 2024
2025 - Present
For comparison with the VVIX plot for 2025:
References
Code
Note: The files below are identical to those linked in part 1.
The jupyter notebook with the functions and all other code is available here.The html export of the jupyter notebook is available here.The pdf export of the jupyter notebook is available here.